All published articles of this journal are available on ScienceDirect.

Intensifying the Fermentation of Aspergillus oryzae in a Stirred Bioreactor Using Maxblend Impeller
Abstract
Background:
The intensification of fermentation in stirred bioreactors is an attractive approach for commercial interests and industries that work with biochemical products. Alpha amylase is an enzymatic bio-products that is produced largely from Aspergillus oryzae. Using adaptable agitator can be an efficient way for stirred fermentation.
Objective:
This study, concentrated on enhancing the mixing process in order to intensify Aspergillus oryzae fermentation. A straight type of Maxblend® impeller was used as an agitator to investigate the incubation parameters compared with the use of a 6-blade double Rushton turbine.
Method:
Stirred fermentation was done in batch condition. Effect of flow pattern of mixing on fermentation parameters was investigated after each sampling.
Results:
The results showed that the Maxblend® significantly intensified both enzyme activity and growth rate at low and moderate rates of power consumption (P). The main reason for the decreases in the growth rate and the enzyme activity during agitation by the Rushton turbine at low and high Pv was the lack of oxygen and mycelial damage, respectively. Additionally, use of the Maxblend® significantly intensified the KLa at low and moderate rates of power consumption.
Conclusion:
Axial and uniform mixing by Maxblend® impeller was resulted in improving the fermentation characteristics and enzyme activity.
1. INTRODUCTION
Aspergillus oryzae is known as a suitable fungus for the production of heterologous proteins. One of the important advantages of A.oryzae is that it can be genetically manipulated [1]. The ability to secrete large amounts of alpha amylase and the development of a transformation system has facilitated the usage of A. oryzae in modern biotechnology [2, 3]. Mixing development of fungus fermentation is one of the ways to reach a desirable level of enzyme activity in agitated submerged cultures. According to the literature [4-6], achieving homogene fermentation medium can result in an efficient mass transfer and a high quality and quantity of production. Many researchers have sought optimal conditions for agitation, because mycelial damage at high stirrer speeds or power inputs can limit the capability and volumetric productivity of a fermenter [7]. In addition, agitators with high volumetric power consumption (Pv=P/V) can have a major effect on a microorganism such as damage to cells, morphological changes, and variations in growth rate and product formation. For each submerged culture, the optimal conditions for agitation depend partly on the resistance of hyphae to the mechanical forces and also on its physiological state [8]. For the fragmentation of fungal pellets induced by different power inputs, there are 4 main mechanisms: interaction between pellets [9], turbulent eddies, the impact of the impellers on pellets, and collision among pellets. Therefore, study of the flow characteristics in a STR by focusing on power consumption is crucial to the design and scale-up of a fungal fermentation process [9-12].
The use of standard impellers is often associated with poor bulk motion and an inhomogeneous distribution of the various phases [13]. In addition, it was reported [9], that during the STR-fermentation of A.oryzae, agitated by three Rushton-style impellers, oxygen mass transfer occurred mainly in the vicinity of the impeller [9].
Because of an existing dynamic relationship between fermentation conditions and fungal growth patterns, an improved impeller that was sufficiently flexible for submerged cultures would be an advantage in the design of fermentation system. One method would be enlargement of multi-stage impellers, and another would be the use of close-clearance designs such as anchors, helical ribbons or Maxblend® (MB). Hydrodynamic advantage of MB impeller is mixing at low power consumption and dispersion in a wide range of Re. This is a wide impeller that combines a lower paddle and a grid. The paddle at the vessel bottom produces a strong tangential flow and a weak axial flow. Common impellers, such as the Intermig, RT and PBT induce mainly radial and axial flows by the moving action of their blades, but in the case of the MB, the nature of the upper part of the impeller reduces the drag and also promotes the formation of pressure gradients. The pumping effect and centrifugal acceleration imposed by MB impeller to the surrounding fluid is minimal [14].
In terms of shearing constant (ks= NpRe), the MB impeller is more efficient than that of a turbine [15]. The MB is effective when mixing performance is important in non-Newtonian cultures such as with a fermentation broth. The mixing performance of the MB and other large impellers in boiling STRs also was investigated by Takahashi et al. [16] and found that the MB had essentially the same performance as competing impellers for these types of applications. The MB has been employed in fermentation processes [17, 18] under aerated conditions showing very significant mass transfer coefficients while keeping the broth culture very well mixed. A numerical investigation was conducted [19] on dispersive mixing involving the MB and a comparison with double helical ribbon impellers and indicated that the MB exhibited a satisfactory local dispersive mixing performance. An experimental study [13] was performed with a wedge-shaped MB impeller and showed that mixing time decreases with the reciprocal of the Re with Newtonian and non-Newtonian fluids in the laminar regime.
Using new large-scale agitators in fermentation to reduce the P and increase the productivity is one of the new approaches in mixing intensification. In this study, we have investigated the fermentation process of A.oryzae with two impeller configurations generating two distinct flow fields: one with traditional double RT impellers, generating high shear rates and a non-uniform shear rate distribution [9], and the other the straight type of large-scale impeller, Maxblend®, MB (Sumitomo Heavy Industries Co., Ltd., Tokyo, Japan), that does not produce significant radial or axial fluid motion directly [14]. The wide geometrical impeller was used to intensify the incubation parameters compared with the stirring of a 6-blade double Rushton turbine (DRT), as a multi stage impeller. In the experimental set-up, adjusting the agitation by both impellers at the same power density was not possible because of some limitations. For this reason, the fermentation study was attempted at roughly close values of Pv for three different ranges (low, moderate and high values).
2. MATERIALS AND METHODS
2.1. Strain and Inoculum Preparation
The microorganism used in the present study was wild type A.oryzae (OSI1013). The fungus was maintained in petri dishes of agar. After inoculation, the dishes were incubated at 30 oC for 5-6 days and subsequently stored at 4 oC. A suspension of spores was obtained by washing the petri dish cultures using a sterile aqueous solution of Tween- 80 (0.05 wt %, Polyoxyethylene (20) Sorbitan monooleate, Wako Co., Kyoto, Japan). The spores were dislodged using a sterile inoculation loop under strict aseptic conditions, and the number of viable spores in the suspension was determined using a hemocytometer (Bürker Türk) (NanoEnTek Inc., Gyeonggi, Korea). The inoculum of A.oryzae was prepared in 100 mL Erlenmeyer flasks containing 15.0 mL of nutrient broth with 1.5×10⁷ spores mL-1. The flasks were sterilized in an autoclave at 121 °C (105 Pa pressure) for 15 min. The medium was aseptically inoculated with suspended spores. The flasks after inoculation were incubated for 3 days on an incubator shaker at 30 °C and 200 rpm.
2.2. Fermentation Experiments and Fermenter Configuration
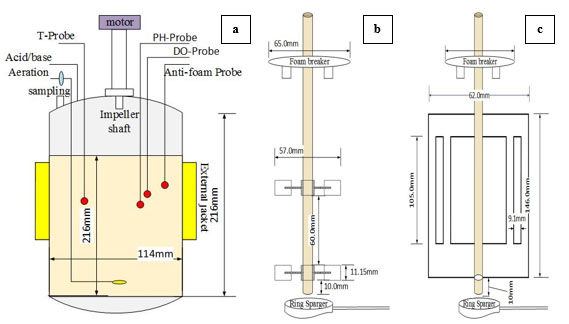
The fermentation experiments for the production of alpha amylase from A.oryzae were carried out in a laboratory-scale, 2.0 L, stirred-tank batch bioreactor, (STBR) (DPC-3A Jar, ABLE BIOTT Co., Tokyo, Japan) with a working volume of 1.5 L. Fermentations were conducted in a cylindrical bioreactor with a vessel inner diameter, H of 0.114 m, with a flat bottom and a broth height to a vessel diameter ratio of 1.3. Agitation was provided by two different impellers: (a) the DRT and (b) the MB. The DRT had D/H ratio of 0.38 and W/D ratio of 0.2. The spacing between the impellers was 1.6D and the lower impeller was located at a distance of 1.4D above the base of the tank. The MB impeller had D/T ratio of 0.54 and W/D ratio of 2.35. The other details of the two impellers and fermenter configuration are shown in Fig. (1). The bioreactor was equipped with monitors, which were used to measure and control the foam, temperature, pH, stirring rate, torque, and dissolved oxygen (DO). The vessel of the bioreactor was equipped with a peristaltic pump to control the foam and pH via the automatic addition of an antifoam agent (KM-70, silicon agent, Shin-Etsu CO., Ltd. Tokyo, Japan) and an acid/base, respectively, also a mechanical foam breaker was used at the top of the culture. The fermentation medium (1.5L) was made up of the following (in g/100mL): Glucose, 3; KCl, 0.2; KH2PO4, 0.1; MgSO4.7H2O, 0.05; Peptone, 1.0; Yeast extract, 0.5 (all from Wako Pure Chemical Industries, Osaka, Japan); and, soluble starch, 10 (Nacalai Tesque, Co., Kyoto, Japan). The medium was added to a fermenter and sterilized in an autoclave, then it was inoculated with 15 mL of previously prepared seed culture. A ring sparger was used to aerate the culture at 1.00 v.v.m. The DO during fermentation was measured using a commercial sensor (ABLE-DO, SDOC-12FL220, ABLE Co., Tokyo, Japan). An external jacket was used to maintain the broth temperature at 30 °C. For a batch operation, the fermenter was run for 72 h. After a fixed interval of incubation, the fermented broth was sampled, then filtered using a 150 mL-20 µm bottle-top filter (Non-pyrogenic and sterile filter, Corning Inc., California, USA), and the supernatant was assayed for alpha amylase activities.
2.3. Alpha Amylase Activity Assay, Glucose Concentration and Dry Cell Weight Measurement
Alpha amylase activity was measured for a 1.0 mL fermentation culture containing 0.5 mL of 2.0% (w/v) soluble starch in 0.1 M phosphate buffer (pH 7.0) and the enzyme solution. The reaction was carried out for different intervals at 30 °C, and the reducing sugar produced was determined via the dinitrosalicylic acid (DNS) method with glucose as the standard. One unit of the enzyme was defined as the amount of enzyme that would produce reducing sugars corresponding to 1 µmol of glucose from soluble starch in 1 minute under the assay conditions. The culture samples were also analyzed to assay the quality of the glucose. This was determined by 3, 5-dinitrosalicylic acid reaction [20, 21], spectrophotometrically at 540 nm. Alpha amylase activity and glucose concentration were measured a minimum of 5 times during each sampling. Average of these values was recorded with standard deviation as the data shown in the diagrams.
Biomass were measured in units of dry cell weight (DCW). The fermentation broth was diluted up to 5 times and filtered. The cell pellet was re-suspended and washed with 20 mL distilled water and filtered again. The pellet was then transferred to a pre-weighted plate and was dried in an oven at 100 °C until reaching a constant weight.
2.4. Morphology Analysis
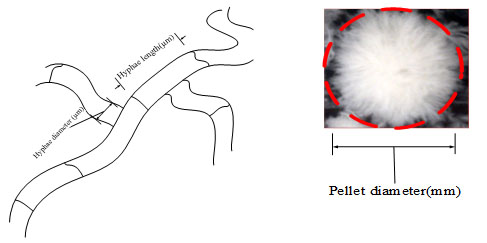
Microscopic images of the fungal pellet were taken using a digital microscope (VHX-100K, KEYENCE Corporation, Osaka, Japan). The microscope was equipped with image processor software to measure the microscopic morphology parameters. Broth samples were diluted by distilled water then filtered, and this process was performed 3 times followed by storage at 4 °C until analysis. The pellet diameter, hyphae length and hyphae diameter were measured for more than 100 cells during each sampling. Besides for analyzing the fungal morphology at least 200 pictures were taken and on each picture the diameter and length of the hyphae were measured 3 times, then average and standard deviation were determined. The morphology factors are shown in Fig. (2).
2.5. Power Consumption and Power Number Measurement
The power consumption, P, was measured via the torque sensor and calculated as shown in equation (1), where N is the impeller rotational speed [s-1] and T is the torque [Nm]. Also, for measuring the torque with high accuracy, the final torque of fermentation culture was measured by attaching the fermentation jar to the SATAKE torque meter (SATAKE Chemical Equipment MFG., LTD., Japan). Based on the torque values, the Pv and Np (=P/ ρN3D5) of fermentation culture using this type of torque meter was shown in Table 1.
In addition, viscosity of fermentation culture after each sampling was measured using B type viscometer (Model B8L, TOKIMEC INC. Tokyo, Japan, the rotor NO. 1 at 0.6 rpm was used). Then the Re (= ρND2/µ) of fermentation culture was measured using the experimentally measured viscosity. The average Re values during each sampling was shown in Table 1.
| Impeller | γ˙ave (s-1) |
Pv (Wm-3) |
Maximum Flow velocity* (ms-1) |
Theatrical impeller tip speed (ms-1) (= πND) |
µeff** | Reave,lam | Np | rps | ||||||
|---|---|---|---|---|---|---|---|---|---|---|---|---|---|---|
| (Pa s) | (s-1) | |||||||||||||
| DRT | 19.2 | 152 | 0.31 | 0.35 | 0.316 | 77.43 | 76.97 | 1.67 | ||||||
| MB | 33.4 | 148 | 0.30 | 0.32 | 0.171 | 106.83 | 93.23 | 1.67 | ||||||
| DRT | 57.5 | 630 | 0.92 | 1.05 | 0.147 | 31.61 | 11.85 | 5.00 | ||||||
| MB | 100 | 687 | 0.90 | 0.97 | 0.08 | 162.7 | 9.6 | 5.00 | ||||||
| DRT | 95.5 | 1487 | 1.46 | 1.75 | 0.103 | 72.13 | 6.33 | 8.33 | ||||||
| MB | 166.0 | 1524 | 1.58 | 1.62 | 0.056 | 81.53 | 4.23 | 8.33 | ||||||
 |
(1) |
2.6. Average Shear Rate and Effective Viscosity Measurement
When growing the cells and producing non-Newtonian cell suspensions, it was useful to show the shear rate in the fermenter via a single parameter such as the fluid dynamic behavior. Many of the terms used in this field were proposed by Metzner and Otto [22]. They proposed equation (2) to estimate the average shear rate ( γ˙ave [s-1]), in a non-Newtonian culture.
 |
(2) |
Where k is the constant used by Metzner and Otto [22]. In this study, k = 11.5 was used for the DRT as in many other studies [23, 24], and k = 20 was recommended to us for MB impeller by Sumitomo Heavy Industries, Ltd [25]. The shear rate constants depend only on the impeller geometry under non-Newtonian conditions. Results of the effective shear rate by MB and DRT impellers are shown in Table 1.
For non-Newtonian fluids, the effective viscosity (µeff) could be defined by the definition used in the Metzner and Otto`s method [22] shown in equation (3).
 |
(3) |
In the equation (3), μeff is the effective viscosity (Pa s), and K and n are the consistency and flow index for power-law fluids. In many previous studies on the rheological model extracted for fungi such as submerged fermentation, the rheological model has been compatible with the power-law model [26-28]. In the present study cell adherence and some problems with dense pellet cells caused unwanted fluctuations while working with the rheometer (HAAKETM viscometer-550, Thermo scientific, USA) to measure shear stress versus shear rate. However, these measurements showed that after t = 24h the behavior of culture completely changed from Newtonian to non-Newtonian (shear-thinning), but finding an accurate value for constant parameters of the power-law models was difficult. The power-law model of Tang et al. [9] was compatible with the rheological behavior of culture in this study and was used as a rheological model of current fermentation culture. The calculated data follows the Ostwald-de Waele model with n = 0.3, K = 2.5 Pa sn and (RT case), 1.82 Pa sn (when using an impeller by the axial flow pattern). Also these values were used for fluid flow simulation.
2.7. Velocity Distribution Simulation by R-Flow
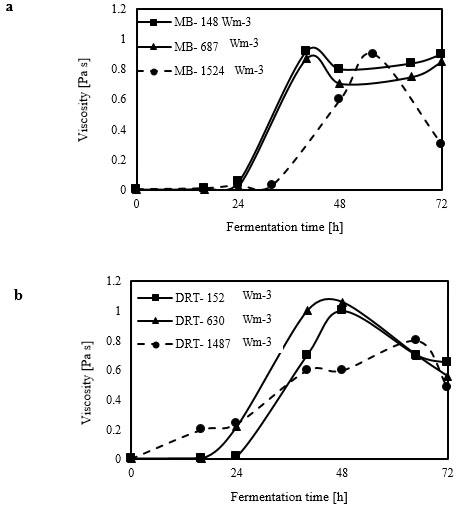
Analysis of the 2-dimensional velocity in the 2 types of impellers was performed using the fluid dynamics software “R-FLOW” (R-flow Co., Ltd., Saitama, Japan) based on Navier-Stokes equations. In the present study, the Eulerian 2-phase model was used to model the gas-liquid flow in a stirred bioreactor. According to the results of viscosity measurement (Fig. 3), most of the fermentation time was done in high-viscosity at relatively low Re.
Due to a thixotropic behavior of culture, the maximum and minimum and average viscosity of culture obtained from each sampling was used to simulate the fluid flow at average Re during different mixing condition and this is one of the difficulty of simulation in the present study. The cell-fluid interactions were ignored, because these would have been difficult to monitor simultaneously with the gas flow in the tank. We noted that during the simulation, the air-flow rate was the same as that for the fermentation experiment. The gas phase was set as that of ambient air at 30 ◦C, and was set with a bubble diameter of 2 mm without considering the break-up and coalescence effects.
The governing equations in this approach can be derived by ensemble averaging of the conservation equations for each phase. The governing equation to a flow-velocity field, uses the mass balance continuity and momentum equation, as follows (equations (4) and (5)):
 |
(4) |
 |
(5) |
where ρ, p, v, g, F respectively are the fluid density, pressure, velocity, gravity and external force. F (F
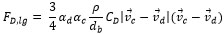
|
(6) |
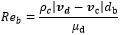
It is noticed that CD is estimated with the formula of the resistance near the bubble as can be seen in equation (7) and (8). In equation (8), ρc, vd, vc and µd are density of continues phase, velocity of dispersed phase, velocity of continuous phase and viscosity of dispersed phase respectively.

|
(7) |
|
(8) |
For the two fluid models, the continuous (fermentation culture) and dispersed (bubble) phases are separately expressed using the equations of conversation of momentum and mass continuity.
2.8. Visualization of Flow Pattern
Visualization of flow pattern of steady-state mixing using MB and DRT impellers was done. The gas-liquid stirred tank at laminar flow was illuminated by laser slit beam, (SUWTECH laser, LCD-1500 (SHANGHAI UNIWAVE Technology, China)). Glycerol ((99% (mass/mass), Wako Co., Kyoto, Japan) was used as a fluid (µ = 0.096 ± 0.005 Pa s, ρ = 1149 kgm-3). The air-flow rate and Pv of each study was adjust the same as that for the fermentation experiment.
3. RESULTS AND DISCUSSION
3.1. Effect of an Impeller on Biomass Intensification and Alpha Amylase Activity
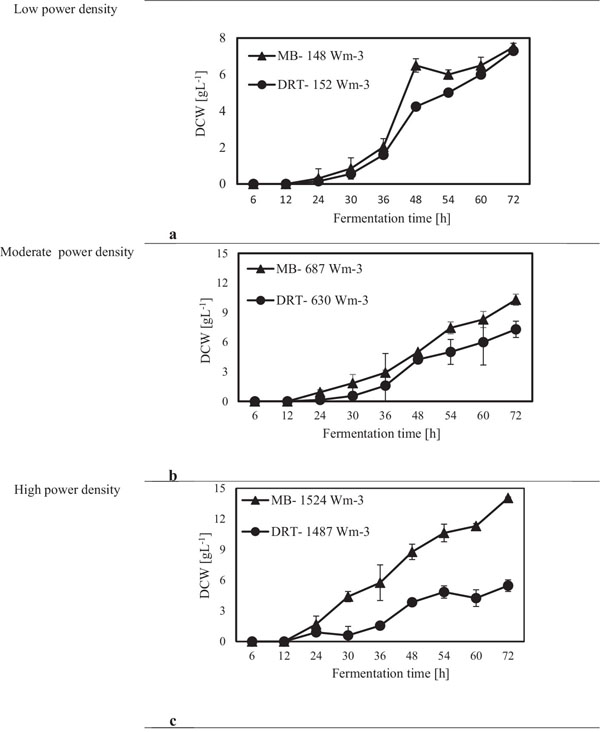
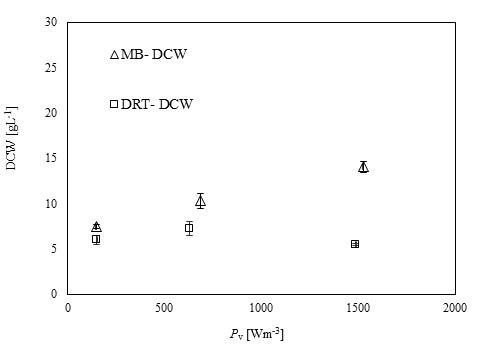
After sampling and extracting the supernatant via filtration of the culture broth, (DCW) was measured, and the results are shown in Fig. (4). It was appeared that in all cases by increasing the power density (Pv) the DCW has been increased. A significant difference between the biomass production by MB and DRT impellers was seen by changing the Pv. Analysis of the results in Fig. (4b) clearly show that when using the DRT at a high Pv, the DCW production was lower than conditions using either MB or DRT under moderate energy consumption. The DCW of cells agitated by the MB impeller at low and moderate ranges of Pv were higher compared with that when using the DRT. Also, the results show that the Pv of the culture broth and a changing of the radial mixing by MB influenced the growth rate of fungi. In addition, the experimental data clearly show that fermentation via the MB impeller at 1524 Wm-3 resulted in the highest growth rate. However, growth rate of fungi when using DRT impeller at high Pv was significantly decreased. The results of DCW versus Pv at t =72 h (Fig. 5) were also compatible with the results shown in Fig. (4).
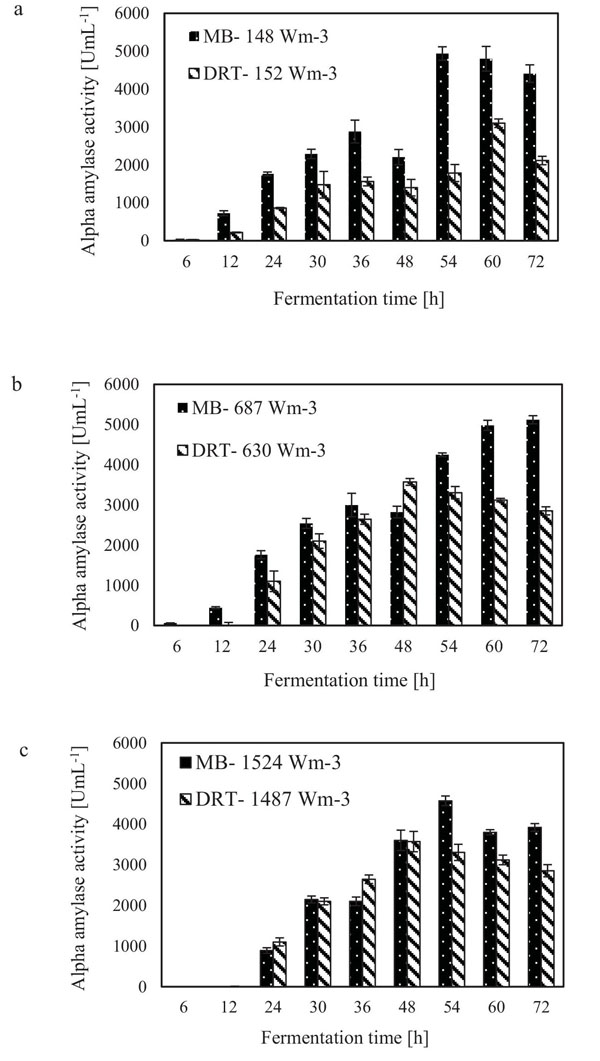
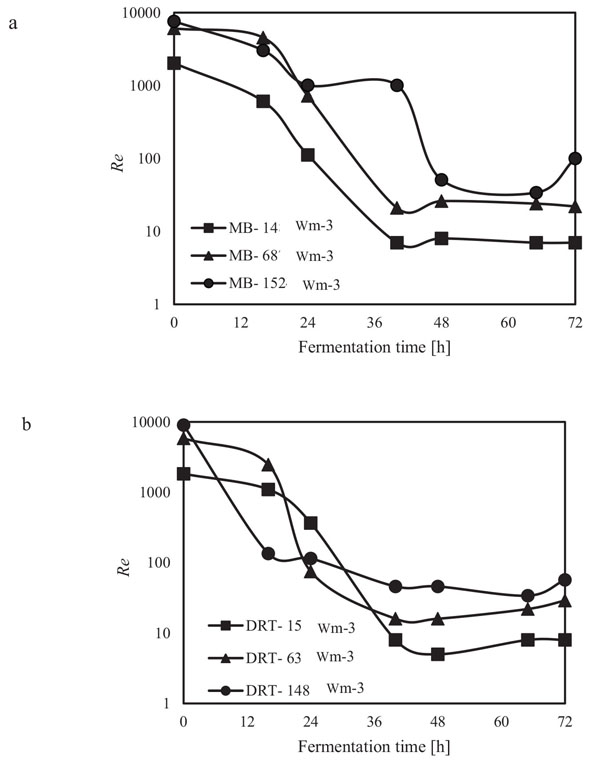
The alpha amylase activity of the fermentation culture was measured after filtration of the culture broth during each sampling. These results are shown in Fig. (6). It is clear that in all cases by increasing the Pv from low to moderate, the enzyme activity was increased, but at high Pv the activity, would be decreased. Diagram of changing Re (Fig. 7) during each fermentation condition showed that the time of cells exposing to the turbulent regime when using MB impeller at high Pv were the highest (Re>1000 until t = 42h). These results are important as a validation of exposure time to stress when using MB impeller at high Pv. Because by increasing the Pv the shear stress (particularly near the grid section of blade) dramatically has been increased and morphology of cells were damaged. Therefore, the enzyme production was decreased however the KLa and DO concentration was increased.
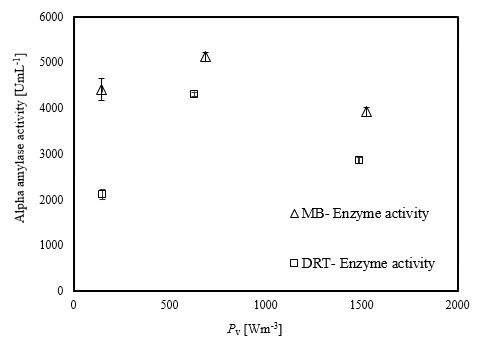
The experimental results of this study showed that increasing the Pv during the fermentation by both impellers had a significant negative effect on both enzyme activity and also the costs of energy consumption. The results of the power density effect on enzyme activity at t = 72 h are shown in Fig. (8). The data show that at low Pv, the mixing by the MB can enhance the enzyme activity in comparison with mixing by the DRT much more than that of the fermentation at moderate and high Pv. Regarding to the results shown in Fig. (5), biomass production could not be the main reason for the large differences between the enzyme activity of the MB and the DRT impellers at low Pv, because the difference between the DCW of fungi agitated at low Pv was not large.
3.2. The Morphology Properties of Fungi at Different Power Densities by the MB and the DRT
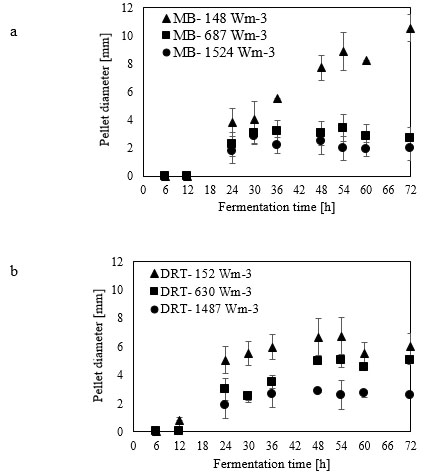
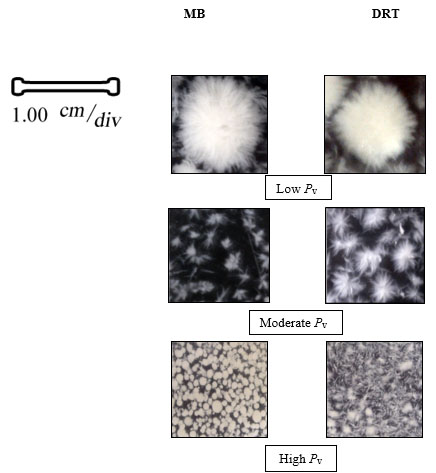
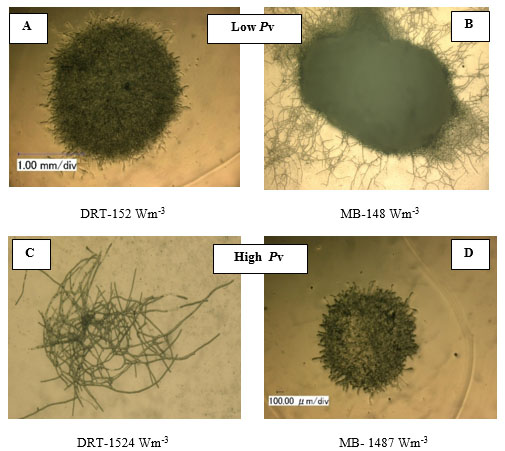
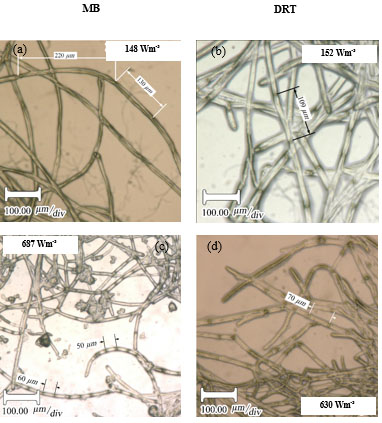
For the production of enzyme by fungi, the pellet is usually reported as being the desired morphology [26]. Free filamentous mycelia give a viscous culture broth as a result of low gas-liquid mass transfer, and high power consumption. Here, the pellet diameter and hyphae length of mycelium were two morphological factors measured at different Pvs. Effect of changing the Pv by MB and DRT on these morphology factors were shown in Fig. (9a and b). In addition, Images of the pellet cell formation during fermentation are shown in Fig. (9c). These indicate that changes in the Pv using the MB impeller caused significant changes in the pellet diameter. The main reason could have been the high mean shear rate when using the MB impeller based on the method established by Metzner [22], and was shown in Table 1. The results of Fig. (9c) show that the cells of A.oryzae were more hairy than the case when the DRT was used at low Pv. Pellets mixed by the DRT at high Pv were attached with large hairy zones, but as shown in Fig. (9c), most of the pellet hairs were broken by the high shear stress at the tip of the blades. In particular, the cells were more subject to damage near the turbine tips where the highest speed gradient were reached. The microscopic image of pellet cells in Fig. (9d) also shows that agitation at high Pv prevented optimized growth of the cells when using the DRT, and, therefore, the morphology of the pellets began to form clumps (pellets with a weak core zone and loosely hair zone). The stressed pellets that were agitated by the MB impeller at high power consumption were without any branched hairy portions.
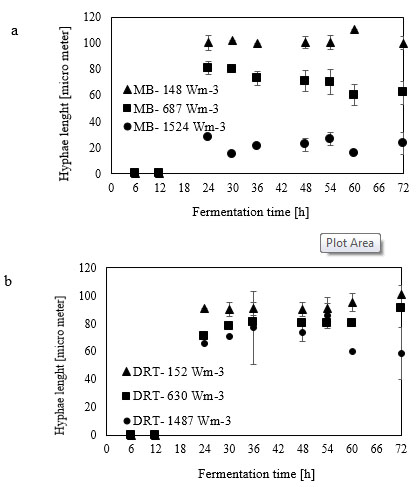
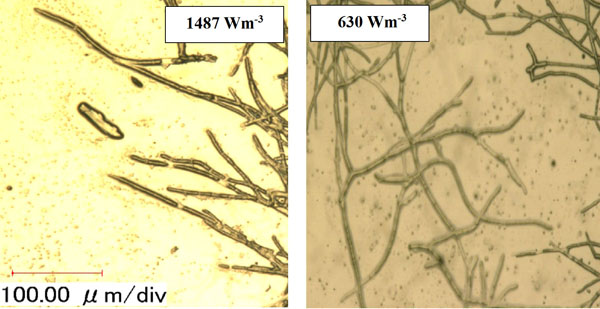
Micromorphology studies (Fig. 10a and b), have shown that changing the Pv by two impellers did not affect the hyphae diameter but the hyphae length of fungi could be changed at low, moderate and high Pv. Measurement results (Fig. 10a and b) showed that by increasing the average shear rate during mixing by the MB at low and high Pv the average hyphae length was decreased from (38.37±8.55) µm to (26.3±5.50) µm. Fig. (10c) shows that because of a high mean shear rate at the tip of the turbine blade most of the hyphae and mycelium was mechanically damaged and cut. Breakage of the hyphae might result in preventing formation of the active tips during fermentation and decreasing the enzyme activity. Microscopic images of changing the hyphae length by changing the impeller type and the Pv from low to moderate values are shown in Fig. (11a). Comparison among hyphae lengths in all four cases showed that the hyphae of pellets agitated using the MB at low Pv, were longer than the samples agitated by the DRT. Therefore, MB provided a convenient medium for elongation of hyphae at low mixing intensity. Fig. (11a and c), show that by changing the Pv of the MB impeller from 148 to 687 Wm-3, the maximum hyphae length of A.oryzae was approximately decreased from (220 ±3.199) µm to (60 ±8.003) µm. Moreover, however fermentation using MB impeller at low Pv, was intensified the enzyme production and also the local stagnant zone could be decreased, but by increasing the Pv the morphology (macro-morphology and micro-morphology) could not be controlled. Also, increasing the Pv during fermentation when using a DRT impeller resulted in the maximum hyphae length reduction. It was of from (109 ±2.553) µm to (70 ±2.523) µm, (Fig. 11b and d).
3.3. Intensification of Oxygen Mass Transfer
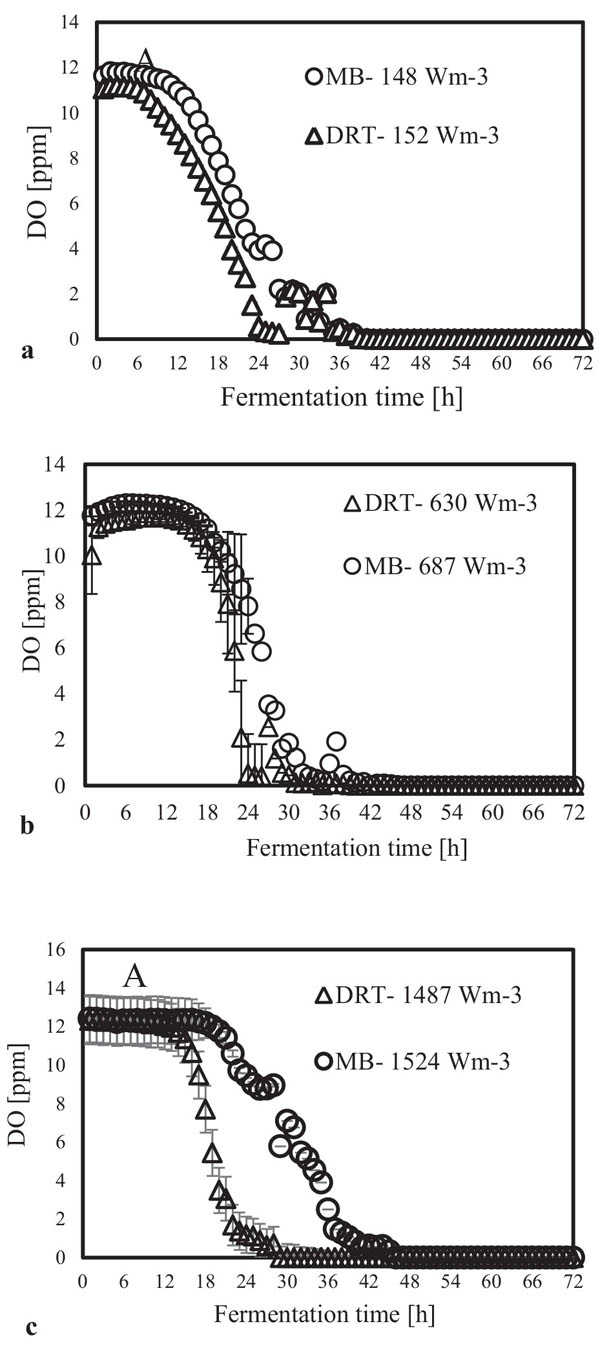
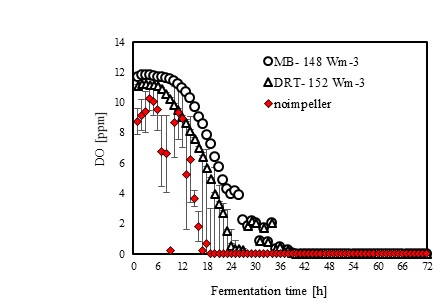
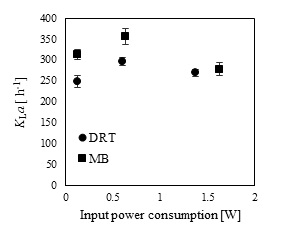
In the present study, a survey on the effect of agitation and impellers on oxygen mass transfer was accomplished by measuring the DO [ppm] in culture media. The recorded values are shown in Fig. (12). In this study, it would be important to note that because the cells had adhered to the DO sensor, the real DO concentration could not be easily recorded. Although the culture DO had not reached zero at 48-54 h after fermentation, the DO probe showed that the concentration of the oxygen was near zero. Therefore, qualitative observations show that the MB impeller may provide better oxygen transfer. Decreasing the mixing time (Appendix) in comparison with DRT at the same Pv could be one of the reason of increasing the DO when using MB. Also, for approving the impact of impeller design as a secondary gas dispersion object, the monitored DO concentration in fermentation culture using both impeller was compared with the DO values in culture that was not agitated (only used ring sparger for aeration) as shown in Fig. (13). Results of Fig. (13) indicate that using the MB impeller can control and keep the DO mixing concentration at high value. Besides, the coalescence of bubble in three different mixing condition were agreed with the recorded concentration of DO mixing. These results were compatible with the other findings [16], it was showed when a large cross-section impeller was operated at a high level Pv, the total level of oxygen inside the impeller was increased. Also, it was found [29] that control of the DO concentration during the mixing of BC (bacterial cellulose) cells using turbine impellers was not possible, and controlling the DO level was not effective for maintaining a high degree of BC productivity. The most distinctive difference between the MB and turbine impellers is the configuration around the sparger [29]. To better understand the effect of impeller configuration, static method [17] was used to measure the average KLa of a fermentation culture. Results of KLa Fig. (14) indicates, the MB significantly intensified KLa at low and moderate power input in comparison with high power input. In addition, the decrease in enzyme activity at high Pv during fermentation by the MB was due to the incomplete growth of the stressed cells. By increasing the KLa, fungal growth rate and also the thixotropic behavior of fermentation culture (changing the Re at different sampling time was the representative of viscosity change by time (Fig. 7) have been increased by an un-controlled way when using MB impeller at high Pv. As shown in Fig. (9d), however, the biomass was increased, but the cells would not grow branches until the end of the fermentation process.
3.4. Properties of Average Shear Rate and Velocity Distribution at Different Pvin Submerged Culture Using the MB and DRT
The average shear rates listed in Table 1 show that these greatly influenced the morphology of the cells in the fermenter. According to the results shown in Table 1 and in Fig. (10a and b), by increasing the difference between the mean shear rates of the impellers, the difference between the hyphae lengths of the cultures was also increased. Study on the behavior of mixing by the MB showed that there was a big difference between the average shear rates (133 s-1) at low and high Pvs, which caused a significant decrease in the hyphal lengths and the pellet diameters. Finally, it can be concluded that changing the power of impellers affects the way of the cells relate to the surrounding environment. Besides, the growth and product formation rates are also influenced. In the present study, at Pv = 148 Wm-3 with the MB, the effective shear rate was more than that with the DRT, but because of uniform culture velocity distribution, cells grew like hairy pellets with a big core zone that formed an appropriate media for mass transfer during fermentation. The simulation results were compatible with the literature [17], showed that the MB dispersed the bubbles with a high degree of shear between the bottom and the tip of the impeller.
The results of the effective viscosity according to Metzner and Otto`s method for each of the average shear rates of the impellers are listed in Table 1. Table 1 showed that using the MB at low Pv (148 Wm-3) could result in a lower µeff (0.171 Pa s), it was compared with using the DRT at moderate Pv, (630 Wm-3), 0.147 Pa s. For example, the µeff of fermentation when using the MB (152 Wm-3) was 0.080Pa s, and when the DRT impellers was used at 630 Wm-3 the µeff reached 0.103 Pa s. This is because increasing the viscosity reduces the circulation that is induced by the DRT impeller [30]. To sum up, it could be concluded that using the MB impeller could intensify the production of low-viscosity cultures (Table 1). Therefore, low-viscosity cultures can enhance the oxygen and nutrient mass-transfer.
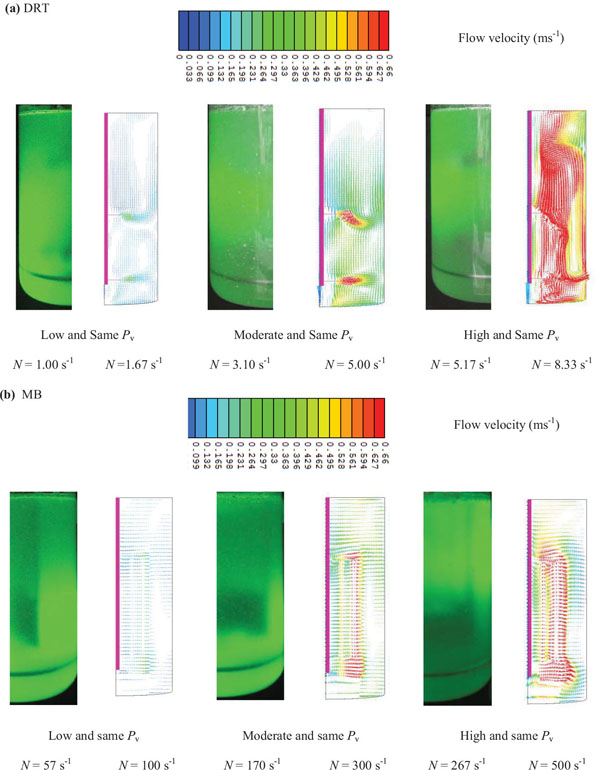
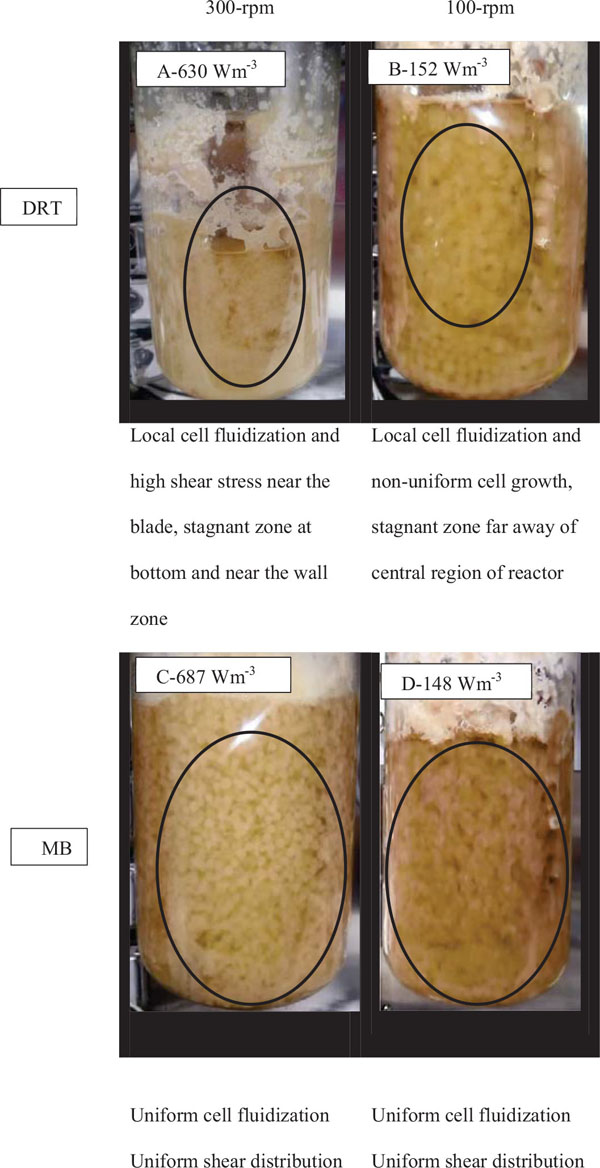
It is noticed that, besides of flow simulation, the gas-liquid flow pattern of mixing at the Pv (similar to fermentation conditions) and aeration rate was visualized using laser beam (Fig. 15a). The results of a velocity simulation (Fig. 15a) showed that when the Pv of mixing with the DRT was increased from 152 to 630 Wm-3, the local velocity near the blade tip was increased from 0.31 ms-1 to 0.92 ms-1 (Table 1 ). Also, while the velocity distribution of the MB (Fig. 15b) was uniform at low Pv, the local velocity, or shear rate, for the DRT was changed. However, the Pv of the DRT (152 Wm-3) was lower than that for the MB, but the local velocity at the center of the DRT fermenter, 0.18 ms-1, was higher than it was for the MB (0.1 ms-1). This local difference could result in a local difference in mass transfer and cell growth and could produce a stagnant zone near the tank wall. The formation of a stagnant zone at the bottom and wall of a fermenter results in cell fluidization, as shown in Fig. (16). At a high Pv when using the DRT, a high velocity profile covered the entire cross-section of the tank (0.31 ms-1) and significantly damaged the cells. Also, the comparison of fluid flow velocity (Table 2) with the recent literatures [14, 19, 30-32] was shown as quantitative validation of flow velocity.
Generally, the results of the effective shear rate and viscosity agreed with the results from the velocity simulation. This means that by uniform changes in the velocity distribution when using the MB impeller at low Pv, the µeff was decreased, and the cell growth and enzyme activity also was increased. It was shown [31] that the local KLa values in the mixing of Xanthan gum by a 3-RT near the bottom of the impeller were 1.4 times greater with a local KLa that was strongly dependent on the local flow field. The results of the velocity distribution (Fig. 15a), show that mixing with the DRT at 630 Wm-3 produced a strong velocity profile near the impellers, and also caused a large degree of loop circulation between the blades, but the region near the shaft and at the inter-zone section of this big loop exhibited high viscosity during the fermentation. The local difference in velocity distribution [33] when using the DRT resulted in a difference between the KLa and the viscosity in the culture. Under these conditions the cells cannot grow sufficiently to produce high enzyme activity. When using the MB impeller (Fig. 15b), however, the velocity distribution was roughly uniform, with the noted exception of a small region near the external grid. The velocity distribution at moderate Pv showed that the velocity of the fermentation culture when using the MB was uniformly distributed. The fluid velocity distribution study, also showed that the velocity of the culture near the wall when using the MB was more uniform than when using the DRT at moderate power consumption. Besides, according to last studies [34] by increasing the working volume during mixing a non-Newtonian fluid by increasing the scale of tanks, the Pv and dimension less mixing time exhibited similar behavior. Also working principles of MB impeller is always the same but exhibits higher or low efficiency depending on the flow regime. It means that this work also has a potential for future works to be done successfully in larges scales.
| Impeller type |
Rheological Model of fluid |
Flow regime- Medium | Velocity around the blade (ms-1) |
Velocity Near the tank wall (ms-1) |
References |
|---|---|---|---|---|---|
| MB | Shear-thinning (n = 0.18, K = 33.1) | Laminar (Re = 30, 65, 120); Xanthan gum solution 3.5% |
(0.33,0.38, 0.66) | (0.27, 0.41, 0.58) | [30] |
| DPP* 3-6ABDT** 3-6ABDT*** |
Shear-thinning (n = 0.71, K = 0.032) | Turbulent,(Re = 1156); fermentation culture of S.avermitilis | 1.50 1.20 1.13 |
0.60 0.50 0.41 |
[29] |
| DRT | Newtonian | Turbulent | 2.0 | 0.48 | [31] |
| MB | Newtonian | Laminar - (Re = 32.4) | 0.6 - 0.8 | 0.45 | [19] |
| MB | Newtonian | Turbulent- (Re = 18000) (Solution of polyethylene glycol 25 wt%) |
0.6 | 0.2 | [14] |
| MB | Shear-thinning (n = 0.3, K = 1.8) | Laminar- fermentation culture of A.oryzae (Reave,lam = 162 ) | 0.85 | 0.36 | This study |
| DRT | Shear-thinning (n = 0.3, K= 2.5) | Laminar- fermentation culture of A.oryzae (Reave,lam = 31 ) | 0.70 | 0.30 | This study |
CONCLUSION
The present study showed that at low power consumption the enzyme activity and biomass production was greatly intensified when using the MB in comparison with the use of the DRT. At low Pv, the difference in the Pv between the two impellers was very small, but the difference in the average shear rate was relatively large. The cell agitation at low Pv when using the MB was larger and more high-branched with higher enzyme activity than when using the DRT. At the highest levels of Pv during agitation by the MB, there was good axial mixing and oxygen mass transfer with no damage to the cells, but the high average shear rate conditions led to inefficient cell activity and finally low enzyme activity.
LIST OF ABBREVIATIONS
| CD | = Drag coefficient - |
| D | = Impeller diameter [m] |
| F | = Force [N] |
| H | = Internal vessel diameter of fermenter [m] |
| k | = k Metzner-Otto coefficient - |
| K | = Consistency index [Pa sn] |
| KLa | = Volumetric mass transfer coefficient [h-1] |
| Ks | = Shearing constant - |
| N | = Rotational rate [s-1] |
| NP | = Power number - |
| n | = Flow index - |
| P | = Pressure [Pa] |
| Pv | = Power consumption per unit volume [Wm-3] |
| Re | = Reynolds number - |
| Tm | = Torque [Nm] |
| Tm | = Mixing time [s] |
| W | = Width of impeller [m] |
| μ | = Drag coefficient [Pa s] |
| μmax | = Maximum specific growth rate [h-1] |
| μeff | = Effective viscosity [Pa s] |
| ρ | = Density of culture broth [kgm-3] |
 |
= Flow velocity [ms-1] |
| τ | = Shear stress [Pa] |
| γ˙ave | = Average shear rate [s-1] |
| α | = Phase volume fraction - |
| DO | = Dissolved oxygen [ppm] |
| DCW | = Dry cell weight [gL-1] |
| MB | = Maxblend - |
| DRT | = Double Rushton turbine - |
| STR | = Stirred tank reactor - |
APPENDIX
Results of Table A1 and A2 indicates in the condition using DRT, the NTm and Tm were strongly depended on Re and Pv, and also it was seen that at the same Pv and ReTm of mixing by MB was lower than that of the DRT.
| Impeller | Correlation ( Re: ~ ) | R2 |
| DRT | NTm = 983.3 Re-0.375 | 0.865 |
| MB | NTm = 198.0 Re-0.190 | 0.815 |
| Impeller | Correlation | R2 |
| DRT | Tm = 2478.0 Pv-1.055 | 0.972 |
| MB | Tm = 918.0 Pv-0.747 | 0.855 |
CONFLICT OF INTEREST
The authors confirm that this article content has no conflict of interest.
ACKNOWLEDGEMENTS
This work was supported by Special Coordination Funds for Promoting Science and Technology, the Creation of Innovation Centers for Advanced Interdisciplinary Research Areas (Innovative Bioproduction Kobe) from the Ministry of Education, Culture, Sports, Science and Technology (MEXT), Japan. We gratefully thank Sumitomo Heavy Industries Co., Ltd., Tokyo, Japan.