All published articles of this journal are available on ScienceDirect.

Biodiesel Synthesis Monitoring using Near Infrared Spectroscopy
Authors Info & Affiliations
Abstract
Objective:
Biodiesel is a renewable fuel considered as the main substitute for fossil fuels. Its industrial production is mainly made by the transesterification reaction. In most processes, information on the production of biodiesel is essentially done by off-line measurements.
Methods:
However, for the purpose of control, where online monitoring of biodiesel conversion is required, this is not a satisfactory approach. An alternative technique to the online quantification of conversion is the near infrared (NIR) spectroscopy, which is fast and accurate. In this work, models for biodiesel reactions monitoring using NIR spectroscopy were developed based on the ester content during alkali-catalyzed transesterification reaction between soybean oil and ethanol. Gas chromatography with flame ionization detection was employed as the reference method for quantification. FT-NIR spectra were acquired with a transflectance probe. The models were developed using Partial Least Squares (PLS) regression with synthetic samples at room temperature simulating reaction composition for different ethanol to oil molar ratios and conversions. Model predictions were then validated online for reactions performed with ethanol to oil molar ratios of 6 and 9 at 55ºC. Standard errors of prediction of external data were equal to 3.12%, hence close to the experimental error of the reference technique (2.78%), showing that even without using data from a monitored reaction to perform calibration, proper on-line predictions were provided during transesterification runs.
Results:
Additionally, it is shown that PLS models and NIR spectra of few samples can be combined to accurately predict the glycerol contents of the medium, making the NIR spectroscopy a powerful tool for biodiesel production monitoring.
1. INTRODUCTION
Biodiesel is a renewable fuel [1-5] considered the main substitute of fossil fuels [1, 6, 7]. It presents reduced exhaust emissions in comparison to petroleum diesel [8-10], it is biodegradable [2, 4, 9, 11, 12], and it is miscible in all proportions to petroleum diesel [9]. Similar properties of diesel make possible the use of blends between biodiesel and diesel in combustion engines without any modification [1, 7].
Industrial biodiesel production is mainly performed by the transesterification reaction of triacylglycerol (TAG) found in vegetable oils and animal fats, with a short chain alcohol like methanol and ethanol in the presence of a catalyst, producing glycerol as a by-product [1, 5, 6, 12-17]. Transesterification reaction occurs in steps producing intermediates like monoacylglycerol (MAG) and diacyglycerol (DAG), which can remain at the end of reaction along with non-reacted TAG and alcohol [3, 14, 16, 18], being contaminants to the produced biodiesel.
In most processes, information on biodiesel production is found essentially through off-line measurements of ester contents of samples taken from the reactor. However, for control purposes, where online process monitoring of biodiesel conversion is required, this is not a satisfactory approach. The most used methods for biodiesel analysis and monitoring are Gas Chromatography (GC) and High Performance Liquid Chromatography (HPLC) [4, 8, 10, 17, 19]. These methods are quite accurate and provide excellent quantitative results, but they are time consuming techniques and involve high costs [1, 3, 10, 16, 18-21]. Infrared spectroscopy has been used as an alternative technique to overcome the disadvantages of off-line methods used in quantification. This technique can still provide accurate results [10, 20], is non-destructive [10, 14, 22, 23], sample pretreatment is not required [10, 23, 24] and it has the advantage of being capable of collecting spectral data online and in-situ [14, 24] demonstrating its ability as a real time monitoring technique.
Infrared spectroscopy refers to the energy in the region of electromagnetic radiation spectrum, and it can be divided into three areas: Near-infrared (NIR), Mid-infrared (MIR) and Far-infrared (FIR) [10]. NIR spectroscopy is a well-established analytical technique based on the absorption of electromagnetic energy in the region from 780 to 2500 nm (12820–4000 cm−1) [3, 13, 18] that generates spectra with overlapping peaks and valleys according to the complex structure of compounds found in the samples.
Chemometric methods are able to process enormous amounts of sophisticated experimental data that are provided by NIR technique [25], and these methods use statistical or mathematical treatments to extract information about a chemical system from the large data generated by NIR spectroscopy measurements [24]. Partial Least Squares (PLS) has been the main multivariate method used in chemometrics [22, 24-26] to develop a calibration model between reference experimental values and spectral data.
When applied specifically to biodiesel analysis, methods based on MIR or NIR spectroscopy and PLS have been developed for biodiesel/diesel blends adulteration monitoring [6, 7, 32, 11, 15, 23, 27-31], biodiesel quality or contaminants determination [13, 16, 33-35], physical properties estimation, as density and viscosity [1, 36, 37], transesterification reaction monitoring [4, 5, 43, 44, 14, 18, 21, 38-42] and quality determination of biodiesel/blends by portable infrared equipment measurements [20, 45, 46], demonstrating even its use for industrial application. Works based on transesterification monitoring are mainly focused on methyl esters [3, 4, 15, 18, 38, 42, 43], however, even methanol actually being short chain alcohol is used due to its low cost and high reactivity [44-48]. There has been a growing interest in the biodiesel produced from ethanol. It is obtained from a renewable source and presents some advantages over the methylic biodiesel, such as higher miscibility with the oil, improved cold flow properties, lower greenhouse gases emission and present higher lubricity when compared to methylic biodiesel [49]. In general, works using NIR spectroscopy are based on calibration models built and applied to samples under well-controlled conditions. The standard experimental procedure generally involves sample collection during reaction, sample neutralization and off-line characterization, for a number of transesterification runs carried out at different molar ratios and catalyst concentrations [4, 5, 12, 14, 18, 21]. These studies involve cumbersome and time-consuming experimental procedures. Efforts to develop robust models based on a small set of samples should still be made to facilitate the transition from laboratory (off-line) data to in-situ applications, as addressed in this paper.
The main objective of this work was the development of a calibration model based on gas chromatography reference measurements combined with NIR and chemometrics for monitoring the biodiesel production from the alkali-catalyzed transesterification of soybean oil with ethanol. Additionally, the quantification of glycerol content using NIR was also addressed. Ester content evaluation and consequently the conversion and quality of the product were the main control variable considered in this study.
2. EXPERIMENTAL
2.1. Biodiesel Production by Transesterification
Ethyl ester was prepared to perform an alkali-catalyzed transesterification of soybean oil and ethanol in accordance with the procedures described elsewhere [50]. The chemicals used were a commercial soybean oil (Leve, acidity 0.20 mg KOH/g, density at 20 °C 0.919 g/cm3), ethanol (Neon, 99.8%) and sodium hydroxide (Exodo, >97%). All chemicals were used as received. Reactions were carried in a 250 mL three-neck glass equipped with a thermocouple, reflux column and stirred with a magnetic bar. The system was kept in a glycerol bath over a heater with a magnetic stirrer.
An ethanol to oil molar ratio of 6:1 was used with 0.6 wt% of catalyst related to the oil mass [3, 14, 38, 51]. Six transesterification runs were conducted in a batch where the mixtures of ethanol and sodium hydroxide were added to the reactor and kept under stirring until complete solubilization of the sodium hydroxide, and then the oil was added, keeping the temperature at 55 °C during 45 min. The total volume of the reactor was transferred to a separation funnel where the lower phase was removed. The upper phase was washed with a 5 wt% solution of HCl P.A. (Vetec) at 60 °C, discarding the lower phase and washing again two times with distilled water at 60 °C.
The ester rich-phase obtained after washing steps was rotary evaporated at 60 °C during 40 min to remove the remaining ethanol. Ten percent of the mass was considered as non-reacted oil, adding ethanol and NaOH keeping the original molar ratio and the catalyst amount, proceeding the second step of the transesterification at the same conditions of the first step. The rotary evaporated product was kept on a stove at 60 °C during 16 h and then it was filtered through sodium sulfate P.A. min. 99% (Vetec) and qualitative filter paper. Produced biodiesel was analyzed by gas chromatography and stored on an amber flask under refrigeration [21].
2.2. Synthetic Samples Preparation
A total of 29 synthetic samples containing soybean oil, ethanol, ethyl ester (produced and analyzed as described above) and glycerol in different proportions were prepared based on different ethanol to oil molar ratios and conversions, simulating the composition in the reaction medium for a soybean oil and ethanol transesterification (without taking into account the catalyst presence in the reaction medium). The molar ratio of 6:1 was chosen to simulate conversion increments of 10%, generating 11 samples varying from 0 to 100% conversion. Molar ratios of 3:1, 9:1 and 12:1 had conversion increments of 20%, generating each one 6 samples from 0 to 100% conversion. The samples were analyzed by gas chromatography and stored in closed flasks and kept under refrigeration.
2.3. Quantitative Analysis
The glycerol content was determined following the method described by Bondiolli and Bella (2005) [52] and contents of ethyl esters, free fatty acids and TAG were determined by gas chromatography (GC) with flame ionization detector based on the European standard EN 14105.
Compound identification for GC method was done based on the retention time of standards belonging to several classes of compounds of interest. Quantification was performed after the instrument calibration with reference substances and internal standards. All the reference standards used to build the calibration curves (glycerol, oleic acid, ethyl linoleate, monoolein, diolein and triolein) were > 99% purity (Sigma-Aldrich).
Prior to chromatographic analysis all samples were silylated with N-metil-N-trimetilsiltrifluoracetamida (MSTFA)(Sigma-Aldrich, 98.5%)and diluted with heptane (Sigma-Aldrich, 99%). The concentration of the injection solution was approximately 1 mg/mL.
All samples were analyzed using a Shimadzu chromatograph (GC 2010 Plus), a capillary column Select biodiesel (15 m x 0.32 mm x 0.10 µm, Agilent), flame ionization detector (FID) and split injection mode (1:10) for 1 µL of the solution. The injection temperature of 380 °C was used for quantification. The injector and detector temperatures were 380 °C and 400 °C, respectively. The oven temperature was programmed to increase from 50 °C to 180 °C with a 15 °C/min rate. The heating rate was reduced to 7 °C/min and the temperature was raised to 230 °C, the final temperature of 380 °C was achieved with a 10 °C/min rate, keeping this temperature during 6 min. The total time of analysis was 36.81 min and helium analytical grade (White Martins) was used as mobile phase. The maximum experimental error of this technique with respect to the ester content determination was 2.78%.
2.4. NIR Spectra Acquisition
The acquisition of the near-infrared spectra was performed in a Vertex 70 (Bruker) spectrophotometer. The spectra were acquired using a Fourier transform transflectance immersion probe, in the wavenumber range from 4000 to 10000 cm-1, with a resolution of 4 cm-1 and 32 scans. The optical path of the accessory was equal to 2.5 mm, measurements were made at 20 °C for synthetic samples and at reaction temperature when the transesterification was monitored, both of them with stirring because the formation of a two-phase system is very fast. The background spectrum was acquired with the empty probe and the NIR data were obtained using OPUS 4.0 software provided with the FT-NIR instrument.
2.5. On-line Reaction Monitoring
For on-line reaction monitoring, a mixture of ethyl esters was produced according to the procedure described in section 2.1, following only the first step of the reaction. The first reaction (R6) was performed with ethanol to oil molar ratio of 6:1 and at each 2 min, starting from 6 min of reaction time, NIR spectrum was acquired at the same time an aliquot of the reaction medium was collected, generating a total of 9 aliquots. The second reaction (R9) was performed with ethanol to oil molar ratio of 9:1, collecting NIR spectrum and an aliquot of reaction medium at each 2 min starting from 2 min of reaction time, generating a total of 14 aliquots. All the aliquots were instantly neutralized with glacial acetic acid and analyzed by GC.
2.6. Data Analysis and Calibration Model
MATLAB R2016a software was used to perform the data analysis (spectra pre-processing) to calibrate and validate the regression model. Outlier detection was performed based on leverage and studentized y-residuals values. Basically, an outlier was identified if its leverage value was 2.5 times above the average leverage value or if its studentized y-residual value was higher than 2.5.
All spectra were mean centered before the modeling procedures. The region with the greatest spectral differentiation was identified and used to develop a multivariate calibration model based on partial least squares regression. First and second order Savitzky-Golay derivatives with different segment sizes were tested as spectra pre-processing techniques. Intending to monitor the transesterification reaction, six different models (M) based on the ethyl ester content prediction were developed using synthetic samples data according to ethanol to oil molar ratios. M1: calibrated with synthetic samples of molar ratios 3, 6, 9 and 12; M2: calibrated with synthetic samples of molar ratios 3, 6 and 9; M3: calibrated with synthetic samples of molar ratios 6, 9 and 12; M4: calibrated with synthetic samples of molar ratios 6 and 9; M5: calibrated with synthetic samples of molar ratio 6; M6: calibrated with synthetic samples of molar ratio 9. These models were selected because they involved the molar ratios used for on-line monitored reactions.
The best number of Latent Variables (LV) was detected by the root mean square error of cross-validation (RMSECV), using full cross-validation method, enabling that all the samples were tested at least once as external data. Model validation was made by the Root Mean Square Error of Prediction (RMSEP) using data from two base catalyzed transesterification reactions monitored on-line that were not used during the calibration step.
3. RESULTS AND DISCUSSION
3.1. Quantification
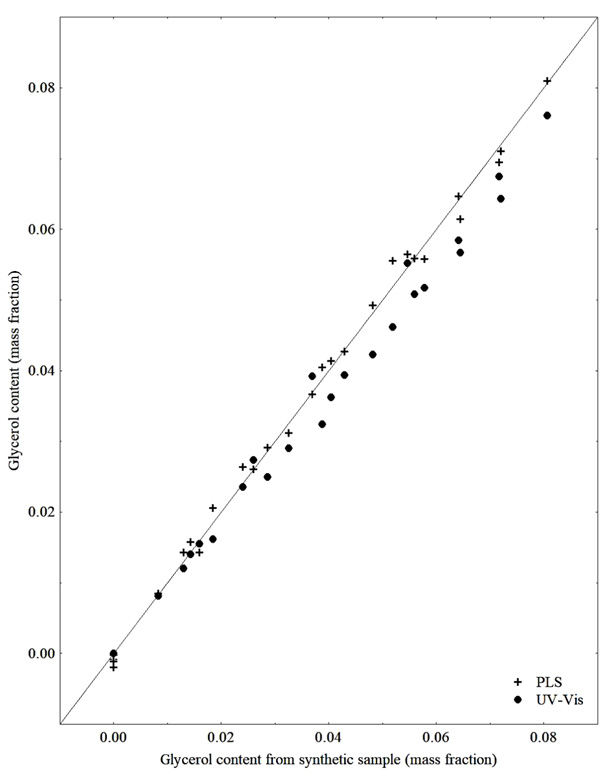
During sample preparation previously to the GC analysis, ethanol was removed in an air circulating oven at 60 oC and then gravimetrically quantified. Glycerol was not detected during GC analysis probably due to decantation during sample preparation, for this reason, glycerol quantification was performed by UV-Vis spectroscopy.
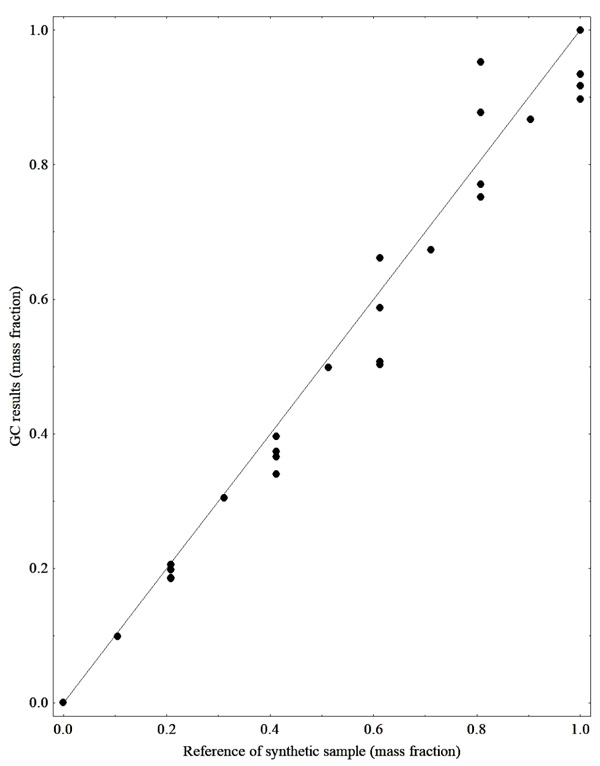
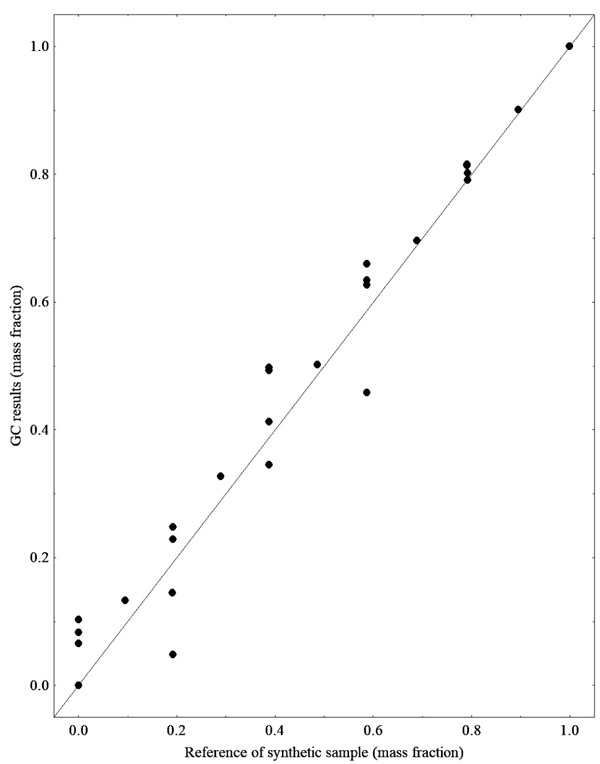
Since we used synthetic mixtures involving biodiesel, ethanol, soybean oil and glycerol, it was possible to compare the GC results with those expected for ester contents according to the mass fraction of synthetic samples, which is the compound of main interest for the construction of the calibration models for transesterification monitoring. Additionally, the results for triacylglycerol (representing the soybean oil), ethanol and glycerol content are also shown below. Figs. (1 and 2) show the comparison for ester TAG content results, respectively, with the ones expected by the mass fraction of each compound used in the preparation of the synthetic samples, both analyses were performed by CG-FID
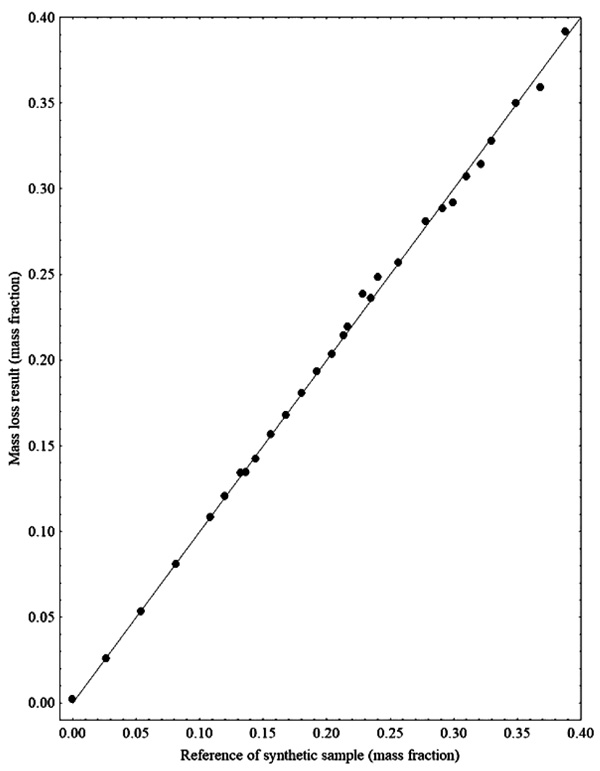
From the results presented in Figs. (1 and 2), it is observed that some data show deviations from the expected value. Therefore, during the calibration step of the PLS regression model tests were performed to identify the outliers. Fig. (3) presents the results for the quantification of ethanol by mass evaporation in a heated oven, showing that the results are within the expected range.
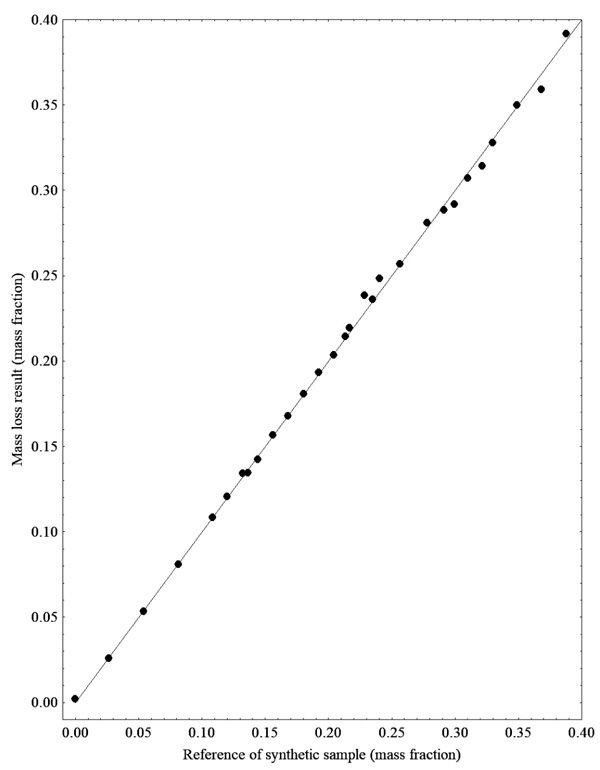
Fig. (4) shows the results of glycerol quantification by UV-Vis and it is noted that the majority of the results were below the expected level. The discrepancy regarding the results for the glycerol quantification can be explained by the high density and viscosity of this compound and also due to the glycerol separation from the ester phase, which rapidly decants and remains trapped in the walls of vials and pipette tips. However, this is not unusual and should not be overemphasized. On the other hand, this issue encourages the development of alternative analytical tools able to accurately detect the glycerol contents in the mixture.
3.2. NIR Spectra and Multivariate Calibration
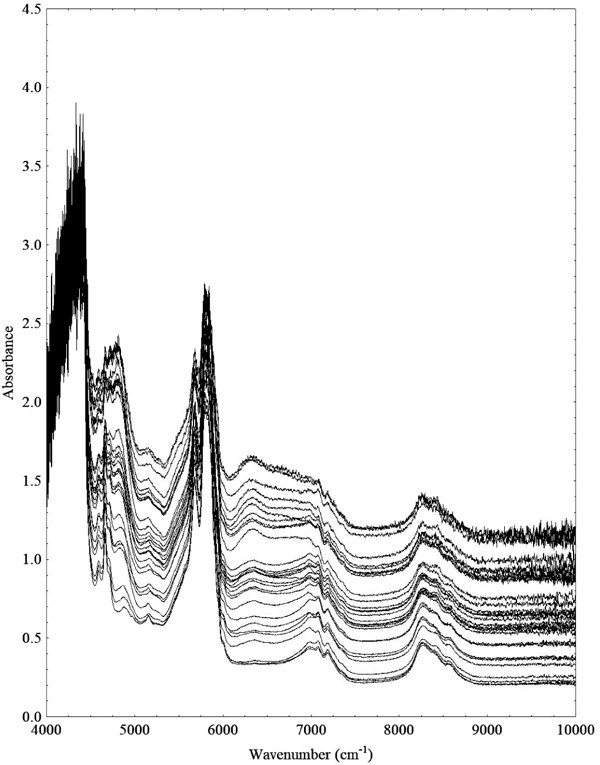
Fig. (5) shows the NIR spectra of the synthetic samples that were used to build the ethyl ester content calibration model. The two extreme wavenumber regions ranging from 10000 - 9000 cm-1 and 4450 - 4000 cm-1presented noisy signal and were not used for the PLS regression model.
3.2.1. Ester Content Prediction Models
The first model M1 was developed using the wavenumber region from 9000 - 4450 cm-1 and according to variable contributions the initial region was reduced, removing wavenumbers with low contributions until lack of model improvement. From all the synthetic samples four data points were detected as outliers following the procedure in section 2.6 and removed from calibration models.
The wavenumber region from 6150 - 5941 cm-1 showed the highest spectral differentiation to build the calibration models. In fact, this region corresponds to the first overtone of C-H stretching for CH2 and CH3 bonds, and to the best of our knowledge the wavenumber region used in this work was not tested yet for transesterification reaction monitoring and is narrower than the regions tested by Lima et al. [14] and Richard et al. [5, 21], which is advantageous because narrow bands can be detected by smaller and portable infrared instruments.
First and second order Savitzky-Golay derivatives with different segment sizes and polynomial order of 2 and 3 were tested to check the model improvement for R6 prediction, however, the results were worse than the ones using raw spectra and in some cases, this pre-treatment generated models with RMSEP values above 10%, as presented in Table 1. The use of only mean-centered spectra is not usual because most of the works using NIR aiming models development for transesterification monitoring have used at least a derivative pre-processing technique [4, 5, 14, 18, 21].
| Derivative order | - | 1 | 2 | ||||
|---|---|---|---|---|---|---|---|
| Polynomial order | - | 2 | 3 | 2 or 3 | |||
| Segment size | - | 11 | 21 | 11 | 21 | 11 | 21 |
| LV | 4 | 6 | 3 | 6 | 3 | 6 | 4 |
| RMSEC (%) | 2.83 | 1.97 | 3.58 | 2.42 | 3.46 | 3.02 | 3.45 |
| RMSECV (%) | 5.39 | 4.88 | 4.57 | 5.14 | 5.75 | 7.91 | 6.41 |
| RMSEP (%) | 4.59 | 5.80 | 6.76 | 9.99 | 7.95 | 12.89 | 11.03 |
The same procedure used to create the M1 model was performed for the other models always using the wavelength region of 6150 - 5941 cm-1 for the calibration and using the data from the on-line monitored reactions for model validation. Predicted values for ester content versus reference values (CG-FID analysis) are shown in Fig. (6).
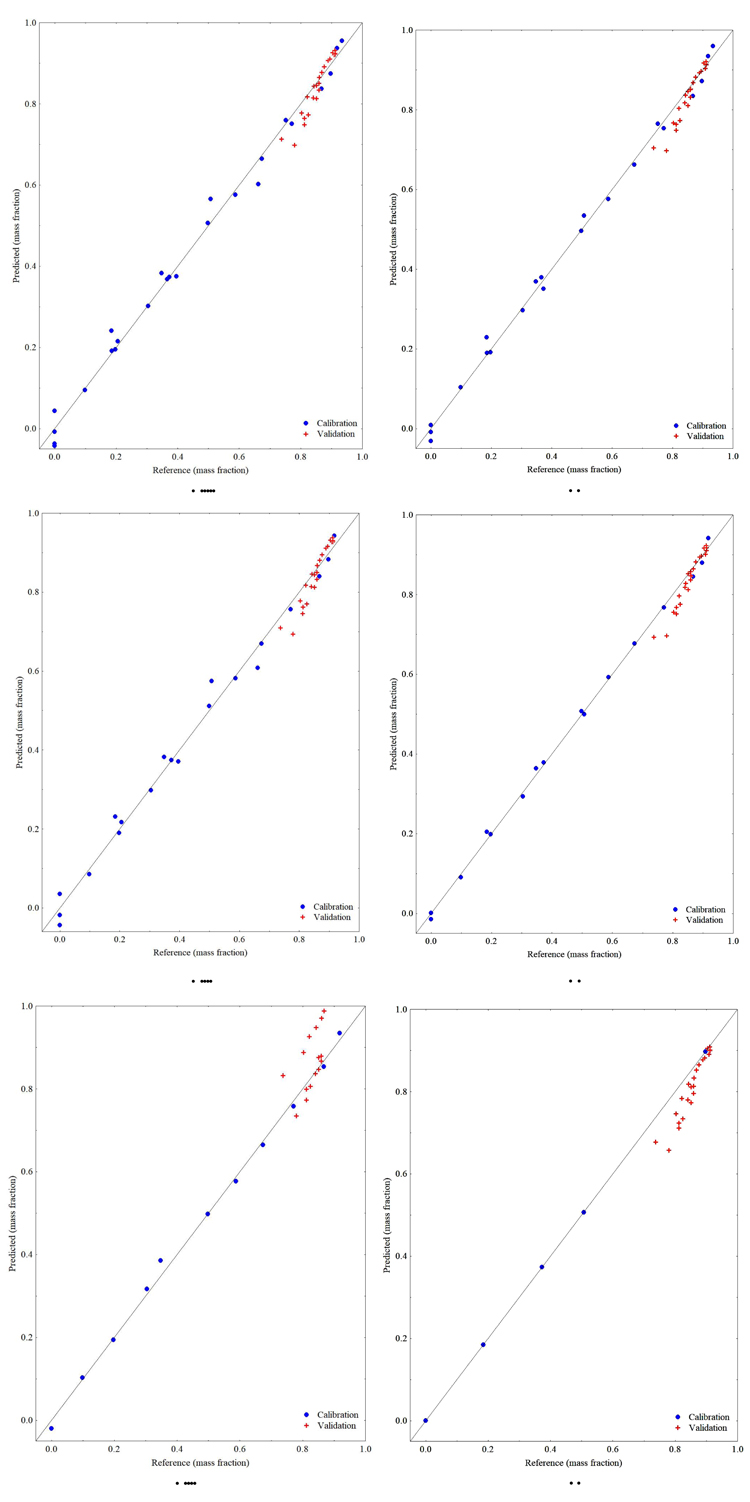
Table 2 summarizes the results of PLS regression models developed with 6150 - 5941 cm-1 wavenumber region and different number of calibration points (N) for ethyl ester content. All of these models were validated using data from two sets of alkali-catalyzed transesterification reaction (R6 and R9).
| Model | M1 | M2 | M3 | M4 | M5 | M6 |
|---|---|---|---|---|---|---|
| N | 25 | 21 | 20 | 16 | 11 | 5 |
| LV | 4 | 4 | 4 | 5 | 2 | 3 |
| RMSEC (%) | 2.83 | 2.01 | 2.94 | 1.30 | 1.60 | 2.05 |
| RMSECV (%) | 5.39 | 4.04 | 6.10 | 4.47 | 2.21 | - |
| R2 | 0.9916 | 0.9959 | 0.9952 | 0.9966 | 0.9931 | 0.9971 |
| RMSEP (%) R6 | 4.59 | 4.63 | 4.82 | 4.44 | 2.41 | 8.13 |
| RMSEP (%) R9 | 1.55 | 1.53 | 1.90 | 2.04 | 11.59 | 2.86 |
| RMSEP (%) R6+R9 | 3.12 | 3.13 | 3.36 | 3.21 | 9.16 | 5.55 |
Based on the RMSEP values generated by the models, M1, M2, M3 and M4 models are quite accurate as the reference method used, and an F-test at 95% of confidence level stated that the four results are statistically the same, therefore any of them can be used for on-line monitoring of transesterification reaction with satisfactory precision. Taking into account the RMSEP for R6 plus R9, the best prediction for on-line monitoring the transesterification reactions will be guaranteed using model M1. However, model M4 can be used if one requires a better prediction for R6 reaction with relatively good results for reaction R9, since this model spent less chemicals and time of analysis due to the lower number of samples used to develop the model.
As expected the models M5 and M6 are only accurate for the molar ratio of reactants in which each model was calibrated. Despite the sensitivity of the spectral data to the ester contents, it is hard to a model being able to predict the ester content in the mixture at conditions far from the ones adopted during the calibration step, and normally the models will be valid for the data range of the dependent variable. Unfortunately, the data set of synthetic samples simulating a reaction with molar ratio of 9 has only 5 data, leading to a model that is not the best one for this molar ratio, as opposed to the model developed with synthetic samples simulating a reaction with molar ratio of 6 that generated the best model to predict the reaction performed with this molar ratio.
Richard et al. [21] developed a model for ethyl ester content prediction using NIR reflectance measurement and the results were RMSEC = 4.08% and RMSEP = 4.10%, with 5 latent variables and 44 calibration samples for a set of molar ratios of 6, 9, 16.2, 22.7 and 45.4, at a reaction temperature of 65 ºC. In the current work, the M1 model presented lower RMSEP values for ethyl ester content prediction for reactions performed with molar ratios of 6 and 9, with only 4 latent variables and less calibration samples. The predicted content of ethyl ester showed no significant deviation from the reference data as shown in Fig. (6A) for the M1 model.
Works for methyl or ethyl ester content prediction during a transesterification reaction, calibrated and validated with only one alcohol to oil molar ratio were developed by Lima et al. [14], obtaining RMSEP = 1.51% with 6 latent variables and 50 calibration samples, and also in the study presented by Pinzi et al. [18] obtained RMSEP = 2.55% with 3 latent variables and 79 calibration samples, and Richard et al. [21] reached a RMSEP = 3.52% for 9 latent variables and 40 samples. In the present work, there are two models calibrated with data from only one molar ratio, the models M5 and M6 which generated RMSEP = 2.41% for molar ratio of 6 and RMSEP = 2.86% for molar ratio of 9. These results are quite good, comparable with the results presented by Pinzi et al. [18] for a methyl ester system, nevertheless, we have used a much lower number of calibration samples.
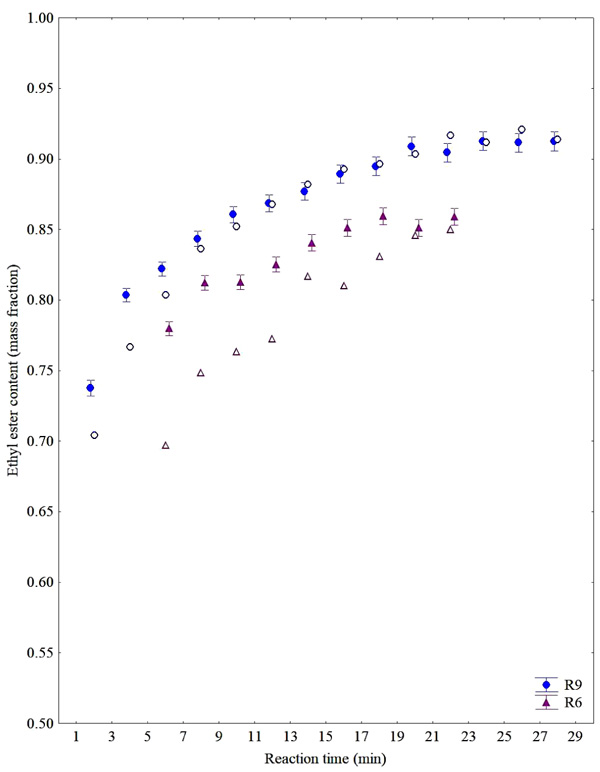
Besides the final ester content estimation in a transesterification reaction, the developed PLS model can be used for motoring the kinetics of the transesterification reaction based on the on-line monitoring data. Fig. (7) depicts a comparison of estimated values based on the M1 model and the ester content measured by CG-FID for kinetic data at a different molar ratio of reactants. The behavior is similar to the one presented by Richard et al. [21] and the equilibrium condition is reached in few minutes of reaction justifying the use of a technique as fast as NIR associated to PLS regression model for on-line monitoring purposes.
Using the models that provided the best prediction results for R6 (M5) and the model with best prediction results for R9 (M2), the ethyl ester content during reaction time progress is presented in Fig. (8).
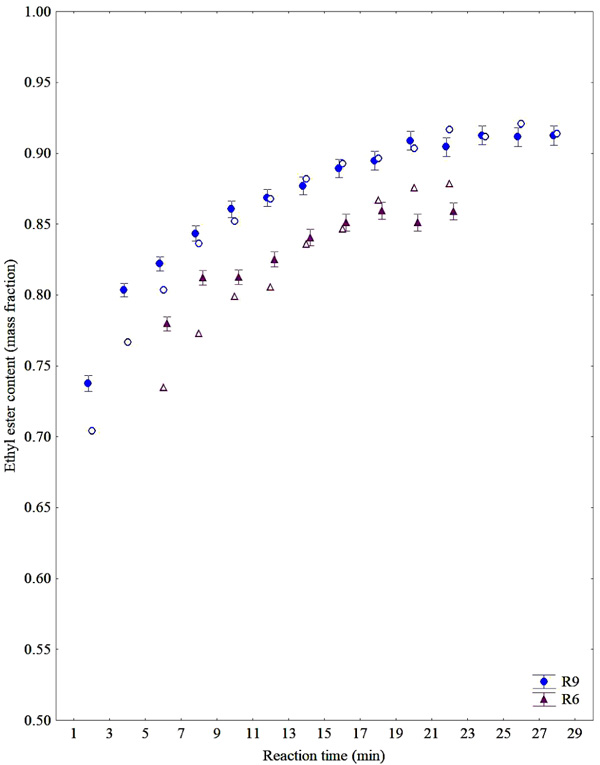
It can be noted as the best fit for the prediction of ester contents during R6 and R9 reactions using the best models of each reaction (Fig. 8). On the other hand, one can also conclude that a single model (such as M1) that is flexible enough to predict both reactions can also adequately serve the purposes of monitoring (see Fig. 7).
In general, the results regarding the overall ester content analysis achieved in this work are very satisfactory considering the following aspects: first, the models were developed from synthetic samples, while most part of the authors perform the reaction at different conditions, collecting at the same time samples from reaction medium and NIR spectrum, neutralizing samples instantaneously; second, models built for NIR spectra acquired at 20 ºC were able to predict data from a reaction at 55 ºC and third, few samples were necessary, representing laboratory cost saving. Consequently, these results are encouraging, and show that the NIR strategy presented is robust enough and could be applied at actual biodiesel production sites as an on-line monitoring tool applied to optimization of production.
3.2.2. Glycerol Content Prediction Model
During the analysis of the synthetic samples, a large deviation between the glycerol results from the UV-Vis analysis and the expected results based on the mass fraction of this compound on the synthetic samples was observed. Since the spectra of the synthetic samples can also be used to develop a calibration model for the glycerol content in the sample, a model was developed, feeding the expected values of glycerol fraction from synthetic samples composition.
In Fig. (9) it can be noticed that most of the results of the glycerol contents of the UV-Vis analysis were below the expected values, as already presented in section 3.1. The prediction model built using PLS regression used the wavenumber range of 5930 - 6181 cm-1, 4 latent variables, RMSEC of 0.15%, RMSECV of 0.15% and RMSEP of 0.20% in relation to the percentage of glycerol in the sample.
The work of Pinzi et al. (2012) [18], focused on the use of NIR in the monitoring of biodiesel production and that of Dorado et al. (2011) [8], focused on the use of NIR to attest the biodiesel quality, also present models to predict the glycerol content. The Pinzi et al. (2012) model presented RMSECV of 0.56% in relation to the mass percentage of glycerol present in the sample, with 4 latent variables and RMSEP equal to 0.73% for validation of the model covering glycerol contents of 0.32 to 3.38 in percentage by mass. Dorado et al. (2011) used a range of glycerol content for calibration ranging from 0.005 to 0.050 in mass percentage and the model associating UV-Vis and NIR presented RMSECV of 0.083%.
CONCLUSION
Several PLS regression models built with synthetic samples for ethyl ester content prediction, based on NIR measurements, were successfully applied for on-line monitoring of alkali-catalyzed transesterification reactions of soybean oil and ethanol. The calibration strategy involved the preparation of 29 synthetic samples to mimic the biodiesel production at different ethanol to oil ratios, the collection of NIR spectra at room temperature (20 ºC) and PLS regression to correlate NIR spectra with the ester content data. The wavenumber range used was narrow (6150 – 5941 cm-1) and the calibration model was able to provide proper predictions of ester contents during transesterification reactions performed at 55 ºC, with mean error values (3.12%) close to the deviations attributed to the reference technique (2.78%). Additionally, a calibration model was successfully built correlating the glycerol content (0 - 8.0 wt%) in the biodiesel and NIR data, with a standard error of prediction of 0.20%.
Results demonstrated that with relatively few experimental data, calibration models can be developed using off-line measurements, showing that NIR is a fast and accurate technique for quantification, allowing an effective monitoring of the reaction and reducing time and process cost in the ethyl biodiesel production.
CONSENT FOR PUBLICATION
Not applicable.
CONFLICT OF INTEREST
The authors declares no conflict of interest, financial or otherwise.
ACKNOWLEDGEMENTS
The authors thank the Brazilian funding agencies (CNPq - grants 406737/2013-4, CAPES and Fundação Araucária) for supporting this work and providing scholarships. The authors also thank the Laboratory of Infrared Absorption Spectroscopy of UFPR for the spectrophotometer availability.