All published articles of this journal are available on ScienceDirect.

Integrated Reservoir Characterisation for Petrophysical Flow Units Evaluation and Performance Prediction
Abstract
Introduction:
An improved understanding of complex clastic reservoirs has led to more detailed reservoir description using integrated approach. In this study, we implemented cluster analysis, geostatistical methods, reservoir quality indicator technique and reservoir simulation to characterize clastic system with complex pore architecture and heterogeneity.
Methods:
Model based clustering technique from Ward’s analytical algorithm was utilised to transform relationship between core and calculated well logs for paraflow units (PFUs) classification in terms of porosity, permeability and pore throat radius of the reservoir. The architecture of the reservoir at pore scale is described using flow zone indicator (FZI) values and the significant flow units characterized adopting the reservoir quality index (RQI) method. The reservoir porosity, permeability, oil saturation and pressure for delineated flow units were distributed stochastically in 2D numerical models utilising geostatistical conditional simulation. In addition, production behaviour of the field is predicted using history matching. Dynamic models were built for field water cut (FWCT), total field water production (FWPT) and field gas-oil-ratio (FGOR) and history matched, considering a number of simulation runs.
Results:
Results obtained showed a satisfactory match between the proposed models and history data, describing the production behaviour of the field. The average FWCT peaked at 78.9% with FWPT of 10 MMSTB. Consequently, high FGOR of 6.8 MSCF/STB was obtained.
Conclusion:
The integrated reservoir characterisation approach used in this study has provided the framework for defining productive zones and a better understanding of flow characteristics including spatial distribution of continuous and discrete reservoir properties for performance prediction of sandstone reservoir.
1. INTRODUCTION
The quest for hydrocarbons has necessitated more detailed reservoir description in the oil and gas industry to facilitate subsurface development and exploration activities. However, the ability to adequately characterize petroleum reservoirs, especially for clastic reservoir systems with complex pore architecture and heterogeneity remains a key challenge. These type of reservoirs exhibit lateral and vertical variations in properties making it very difficult to predict the distribution pattern of properties and the entire reservoir performance. Inadequate reservoir characterisation can incur insignificant cost and failure of various oil recovery techniques. Conceptually, having detailed understanding of spatial distribution of reservoir properties and the diagenetic constraints can petition reservoir engineers and geoscientists to model and predict the production behaviour of petroleum reservoirs. More importantly, it is imperative to use reliable reservoir characterisation strategies in order to enhance reservoir description. One of the most important aspects of reservoir characterization process is to subdivide the reservoir into flow units. Considering this will help to quantify the reservoir heterogeneity more sufficiently and differentiate between the productive and non-productive zones of the reservoir so that issues related to rates of fluid flow, fluid-in-place and fluid recovery estimates can be addressed easily.
The concept of flow units has been extensively used for classifying different rock types based on geological properties and flow dynamics at pore level. These flow units imitate similar attributes of the whole reservoir system having the same geological and petrophysical parameters that consistently influence fluid flow in a reservoir [1-4]. Geologist describes flow units as geological flow units or lithofacies according to their similar diagenetic and depositional overprint using analysis of core samples and core description [5].
Different techniques and methodologies have been adopted to characterise flow units and predict reservoir performances. These include the reservoir quality index method, stratigraphic modified Lorenz method, fuzzy logic approach, testerman statistical zonation technique, normalised reservoir quality indicator method, depositional and diagenetic overprint and correlated flow index method at uncored wells, among others. Besides the various techniques and methodologies available in literature, the neural and multi-resolution graph-based clustering technique proposed by Nouri-Taleghani et al. [6] has also gain wide acceptance. Many researchers have adopted the flow unit concept in different dimensions to address issues related to reservoir heterogeneity at pore-scale in sandstone reservoirs. Recent among these include Onuh et al. [7], Shedid [8] and Zhang et al. [9].
Onuh et al. [7] in their research used normalised pore radius concept and modified the reservoir quality indicator method to characterise hydraulic flow units in thin-bedded canyon turbiditic sandstone reservoir, Niger Delta. They included different techniques such as the cumulative normalised reservoir quality method, Leverett J-Function curve, Stratigraphic Modified Lorenz technique to delineate reservoir flow units. However, their methodology did not take into account the clustering-based algorithm method and stochastic modeling approach to reservoir characterisation.
Zhang et al. [9] quantified heterogeneity of sandstone reservoir by adopting three-dimensional geostatistical flow unit classification method. Their case study focused on non-marine sandstone reservoir, Gaoji field-China. In their study, they combined paraflow unit concept reviewed by Zhang and Cheng [10] with conventional geostatistical modeling approach to classify and model reservoir flow units at pore level.
The paraflow unit (PFU) concept was first reviewed by Zhang and Cheng [10]. It was introduced purposely to investigate the heterogeneity of low-permeability sandstone reservoirs for enhanced reservoir description. Comparatively, the PFUs generally provide better reservoir description than conventional-derived flow units especially for sandstone reservoirs of non-marine origin due their high complex heterogeneity. The paraflow unit method makes use of clustering analysis. This analysis is a mathematical statistical approach which groups objects in such a way that these objects would have similar attributes, called a cluster. However, the concept have the assumption that PFUs are homogeneous within a given reservoir unit. Hence, paraflow units subdivide flow units into homogeneous zones (instantaneous flow units) whilst flow units subdivide the reservoir volume into consistent zones [9].
Shedid [8] proposed the shale number concept, a mathematical model developed and calibrated to delineate possible flow units in shaly sandstone reservoirs. The shale number model combined rock and fluid properties including petrophysical parameters and hydraulic flow conditions of reservoir rocks for flow unit characterisation. The model was evaluated with available flow unit characterisation techniques which included the RQI, FZI, Leverett J-Function curve and permeability-porosity crossplots to characterise sandstone reservoir.
Considering the review conducted, it can be concluded that the different authors have used the flow unit concept with different methodologies to characterise sandstone reservoirs. This paper introduced integrated methodology utilising clustering algorithm analysis, geostatistical methods, reservoir quality indicator technique to evaluate significant flow units from core and calibrated log data and combining these methods with dynamic simulation to predict the performance of marine sandstone reservoir. Additionally, it provided the platform to model the reservoir properties at fine scale into two-dimensional view to improve description of the reservoir.
2. RESERVOIR DESCRIPTION AND PRODUCTION HISTORY
The reservoir investigated in this research synthetically named reservoir X is located in the Gulf of Guinea depositional belt. It is a deep offshore reservoir consisting of sandstones as the major lithology. The reservoir sands are characterized as unconsolidated of which fine-grained and coarse-grained sand bodies are generally observed.
The bedding characteristics of the reservoir reveal the presence of intercalated shale sequence within sand bodies and faulted zones which may likely form permeability baffles to vertical flow [11]. The reservoir is an elongated barrier-type deposit portraying good structural continuity from the north to the east direction of the basin. It has very good permeable zones and wide range of porosity values. The reservoir has consistence pay interval with layers described by vertical and lateral changes in properties. There is a strong aquifer at the base of the reservoir rock towards the northern and western direction. There are 12 wells in the reservoir but only six of them are actively producing wells. Regional geological studies of the field proved an estimated reserve of 200 MMSTB (STOIIP) and 4.2 BSCF (GIIP), respectively. There is excellent pressure communication between the reservoir units as well as the producing wells. Production of the field started in the year 1993 and fluid injection commenced in 1997 when the reservoir pressure declined indeterminately below the initial pressure of 4900 psi. The production performance of the field is 86.5 MMSTB, representing 41.98% field efficiency. The average water cut recorded (2002) was approximately 80%. It is a black oil reservoir system with stock tank oil density of 28.6 API ̊.
The reservoir is a real field case which was operated by Elf Exploration and Production. Detailed well test analysis conducted on the reservoir revealed that, a constant production rate of 1700 stb/day is achieved for the first 4 years of production and 2-weeks extended shut-in period per year adopted to monitor pressure for all the six active wells. During the first 8 years of production, well PRO-4 experienced a water break through whereas PRO-1 and PRO-3 have gas breakthroughs. Afterwards, no other well had production influence from water or gas breakthrough. The proven oil column for the reservoir is 168 ft and fluid densities (oil, water and gas densities) at surface conditions obtained are 56.93 lb/ft3, 64.43 lb/ft3 and 0.0518 lb/ft3, respectively [12]. Table 1 shows the reservoir rock and fluid properties.
| Reservoir Parameter | Value |
|---|---|
| Reservoir temperature | I68 ̊F |
| Stock tank oil density | 28.6 API |
| FBHP (07/17) | 1950 psi |
| Water oil contact, WOC | 7856 ft |
| Gas oil contact, GOC | 7726 ft |
| Average reservoir thickness, h | 42 ft |
| Average porosity, ϕ | 0.28 v/v |
| Average permeability, K | 3265 mD |
| Initial water saturation, Sw | 0.21 v/v |
| Reservoir oil viscosity, μo | 2.5 cp |
| Proven oil column | 168 ft |
| Oil formation volume factor @ Pi | 1.251 rb/stb |
| Gas gravity (air = 1) | 0.85 |
| Oil density at surface conditions | 56.93 lb/ft3 |
| Recovery factor (07/17), RF | 41.98% |
| Cumulative production (07/17), Np | 86.5 MMSTB |
| Rock compressibility | 3 x 10⁻⁶ psi-1 |
| Initial reservoir pressure, Pi | 4900 psi |
| Bubble point pressure, Pb | 3000 psi |
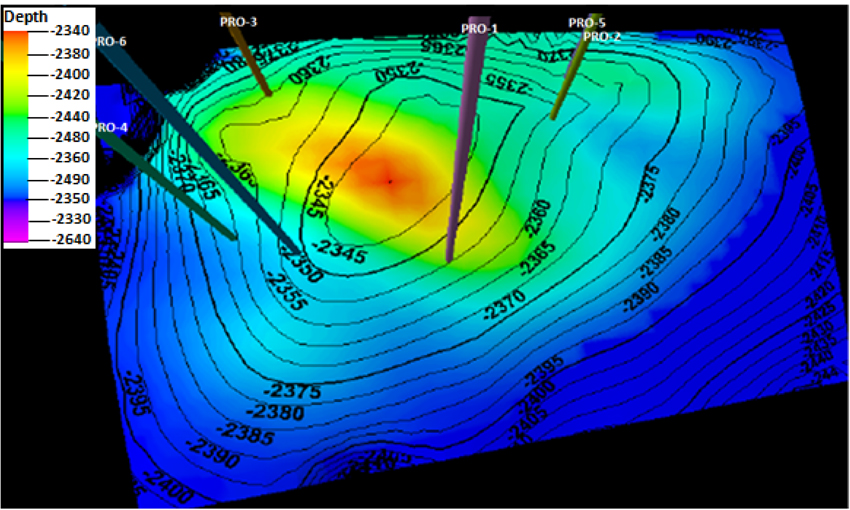
2.1. Reservoir Model Description
The model was built from the corner point geometry modeling approach using eclipse simulator. The defined region of stationarity for the reservoir grid model is 200 x 200 x 6. The reservoir model has five layers of which the grid sizes in the x and y directions for each layer are approximately 200 ft. The z-direction has approximately 52 ft for each layer. The model has a dome-shaped structure with gas cap located at the top. It shows the contoured oil saturation zones and locations of the six producing wells. There is a strong aquifer support connected to the northern and western parts of the reservoir model which helps to drive reservoir oil to the producing wells. The six existing wells are located in grid blocks, 7:7:4, 2:3:6, 9:4:5, 7:3:4, 3:7:6 and 5:9:1, respectively. The total number of grid blocks sum up to 2660 in the reservoir model. There are 1761 active blocks in the reservoir model. The phase distributions in the reservoir are predominantly water, oil and gas. The oil-water and gas-oil contacts for the model are located at 7856.3 ft and 7726.4 ft, respectively. The solution gas-oil-ratio for the model at the initial reservoir conditions is 298 scf/stb. Fig. (1) shows the model for reservoir X with locations of wells.
3. MATERIALS AND METHODS
3.1. Method Used
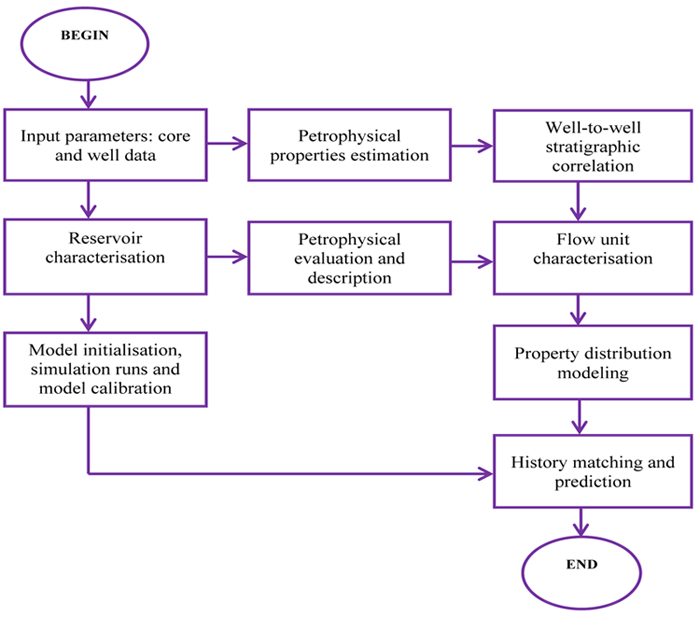
This research focused on the use of an integrated approach combining cluster analysis, geostatistical methods, reservoir quality indicator technique and simulation to provide a petrophysical description and properties that can be used for performance prediction. The methodology involves petrophysical evaluation of the reservoir unit, characterisation of significant flow units, spatial analysis of reservoir properties for delineated flow units and performance prediction using history matching. Core data and petrophysical logs were used for this research. To start with, the well data was scaled to a reference depth to ensure homogeneous dataset adopting well-to-well correlation strategy. The petrophysical log data was calibrated with core data for the wells investigated in this research, i.e. PRO-1, PRO-3 and PRO-6 as shown in Fig. (1). On application of the RQI method, the different flow units for wells in the reservoir were correlated and determined from calibrated dataset. Then, paraflow units were classified for the reservoir using Ward’s analytical algorithm. The algorithm was used to perform cluster analysis (statistical analysis) such that the reservoir flow properties which included porosity, permeability and pore throat radius were classified into similar groups. Conditional simulation was performed to generate 2D numerical models to analyse porosity, permeability, oil saturation and pressure distributions for flow units of reservoir X. For the purpose of performance prediction of the field, dynamic models were built for field water cut, field water produced and field gas-oil-ratio. The proposed models were initialized and history matched. Fig. (2) shows the summarized workflow for methodology.
3.2. Petrophysical-Based Reservoir Description
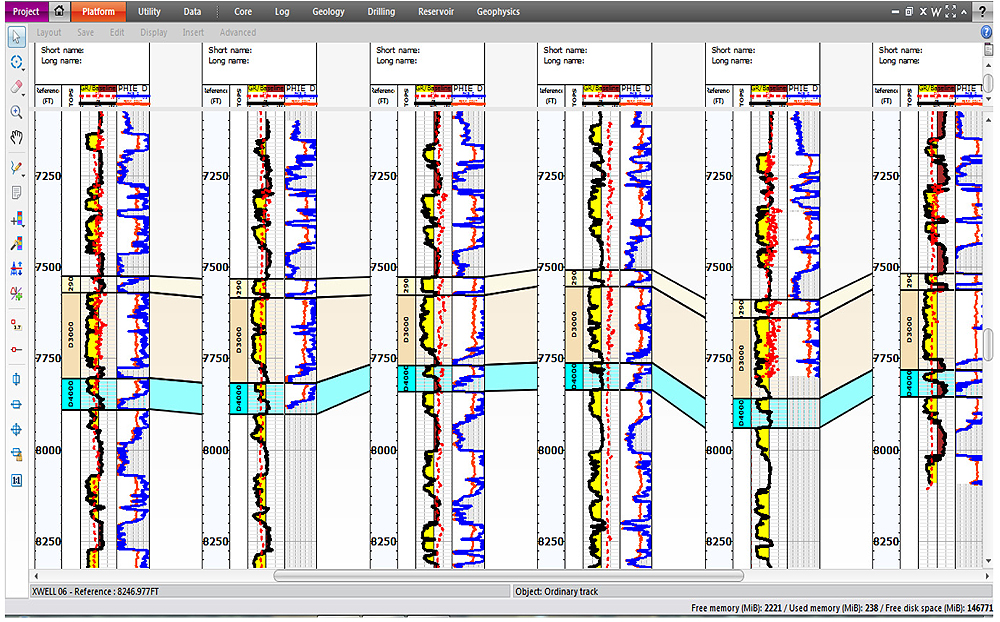
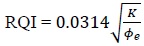
Detailed petrophysical analysis and hydraulic flow unit delineation for effective reservoir characterisation and formation evaluation is a requirement for oilfield development [13]. In this study, petrophysical evaluation of the reservoir units were carried out to assess the quality of the reservoir sands and to describe the reservoir flow characteristics. The RQI methodology proposed by Amaefule et al. [14] was adopted. Also, adopted is the Tiab [15] hydraulic flow unit characterisation factor (HT). These concepts were used to characterize the reservoir in terms of its hydraulic qualities. The HT parameter utilizes both petrophysical and geological properties to characterize hydraulic flow units of reservoir rocks on a macroscopic scale [16]. Clustering algorithm was implemented to determine the pore throat radius (r35) for the various reservoir units utilising Winland permeability-porosity determination equation for paraflow unit classification. Before the evaluation task was performed, core data for the three producing wells were calibrated along with the log data for data reliability check and quality assurance. These corrections were extended across the interested wells in the reservoir. Detailed log interpretations for the three wells were made and the log data plotted on techlog-view in Fig. (3). Also, interpretations were performed for other logs: caliper and density, deep resistivity, neutron porosity and facies. Petrophysical parameters which included: reservoir quality index, effective porosity and permeability were plotted on techlog-view in Fig. (3) to describe their vertical variations in the reservoir. Lithological determination was carried out for which shale and or sand was defined as the major lithofacies of reservoir X. Depth matching was also performed for which the various depths were compared vertically to the signature of logs indicated on the techlog-view in Fig. (3). Quality checking was made in sections where the logs gave incoherent interpretations. This was executed to rectify the inconsistencies in the log interpretations. The lithology matched to the core depths and the logs also showed similar results. For this research, the FZI, RQI, HT, ϕz and r35 parameters were obtained from equation (1) to (5) below:


where
RQI = Reservoir Quality Index, (µm)
HT = Tiab Hydraulic Flow Unit Characterisation Factor, (µm-2)
ϕz = Normalised Porosity, (fraction)
ϕe = Effective Porosity, (fraction)
K = Permeability, (mD)
r35 = Pore Throat Radius, (µm)
FZI =Flow Zone Indicator, (µm)
3.3. Stratigraphic Correlation of Reservoir X
The structure of the reservoir is important in describing its flow behaviour. In this research, the six wells of interest in the study area were correlated. This is to provide detailed knowledge of the lithology (rock types) and stratigraphy, so that the various petrophysical properties can be evaluated to describe the reservoir flow behaviour. Nimisha et al. [17] has stated that connectivity of flow units at interwell locations is a key requirement for fluid flow prediction in the reservoirs. On this note, well-to-well stratigraphic correlation of the reservoir is performed at a reference depth/interval for which a common base line for sand and shale volume was established across the entire the reservoir. Afterward, quantile normalization of the various well logs was carried out, utilising linear transformation at 5% and 95% percentiles. The minimum and maximum percentile values of calibrated gamma ray log readings for typical sand and shale after the normalization process peaked at 10 API and 100 API units, respectively. Normalization of the logs resulted in an average cut-off gamma ray log reading of 55 API units across the field. The calibrated well logs were used in the reservoir property distribution modeling and petrophysical evaluation of the reservoir units. Fig. (3) shows the lithologic cross section of the reservoir within the sector of study.
3.4. Reservoir Quality Evaluation and Flow Unit Characterisation
Well PRO1 demonstrated the presence of minor shale intercalations dominated within the studied reservoir units. It exhibits well-defined permeable zones and continuity of clean sand bodies within the depositional settings of reservoir X. The log data for well PRO1 categorised the reservoir as having good permeability and porosity. Well PRO1 had three flow units intersecting the reservoir sands. The log interpretation showed that well PRO1 contained minimal shale sequence compared with sand. Less shale volume in this well petitioned more flow units delineation. The shale content estimated in the reservoir for well PRO1 can have less impact on the average permeability and porosity. This can significantly cause different flow units to be defined in the reservoir sands at different sections within the zone of interest. Well PRO1 portrayed the reservoir characteristics of having good quality to enhance prediction of hydrocarbon bearing layers and fluid flow across the studied reservoir. Fig. (4) shows the results of the log interpretation and reservoir quality plot for well PRO1. Table 2 presents the flow characteristics of the reservoir for well PRO1.
Well PRO3 revealed consistent two flow units defined within the reservoir sands along the specified interval. More porous sand bodies are found in the region where well PRO3 penetrated the reservoir. Also, minor shale baffles are observed in the reservoir at the location of well PRO3. The diagenetic constraints of reservoir X can present sand pinch outs which could truncate some flow units existing in the reservoir. Many flow units identified in well PRO1 and PRO6 with fewer flow units delineated in well PRO3 can be explained by flow unit truncations occurring at certain parts of reservoir X. The structural correlation of the reservoir shown in Fig. (2) indicated the possibility of faulted zones occurring in well PRO3 as the reservoir sand unit gradually pinched towards the direction up to the point where well PRO3 intercepts it. This can definitely obstruct the movement of fluids channeled within the flow units of well PRO3. Comparatively, less flow units is defined in well PRO3 relative to the other wells considered. Two flow units observed in this well may be the result of high shale baffles acting as permeability barriers. Fig. (5) shows the results of the log interpretation and the reservoir quality plot for well PRO3. Table 3 presents the flow characteristics of the reservoir for well PRO3.
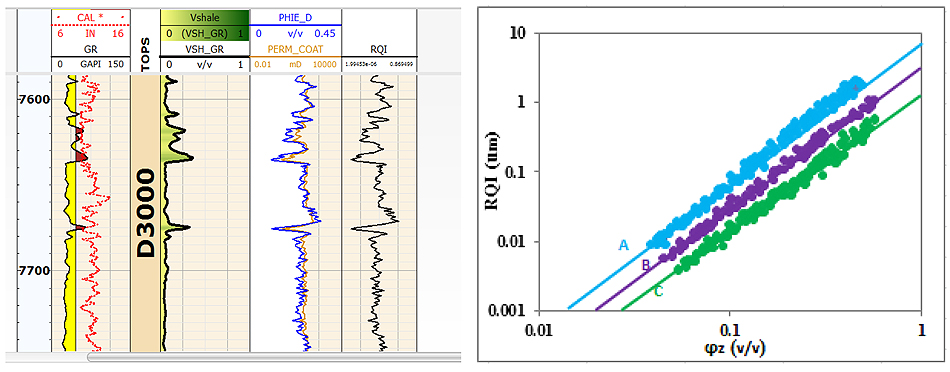
| Flow Unit | Gradient | FZI (µm) | HT (µm-2) | R2 | Wells of Occurrence |
|---|---|---|---|---|---|
| A | 2.02 | 9.05 | 12.2E-3 | 0.90 | PRO1, PRO3 |
| B | 2.05 | 3.95 | 6.41E-2 | 0.87 | PRO1, PRO6 |
| C | 2.10 | 1.56 | 4.11E-1 | 0.92 | PRO3, PRO6 |
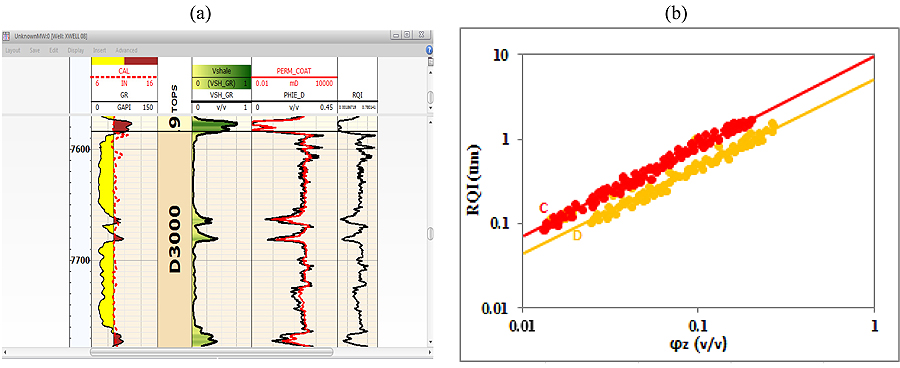
| Flow Unit | Gradient | FZI (µm) | HT (µm-2) | R2 | Wells of Occurrence |
|---|---|---|---|---|---|
| C | 2.74 | 10.00 | 10.0E-3 | 0.92 | PRO3, PRO6 |
| D | 2.12 | 4.85 | 4.25E-2 | 0.95 | PRO3, PRO1 |
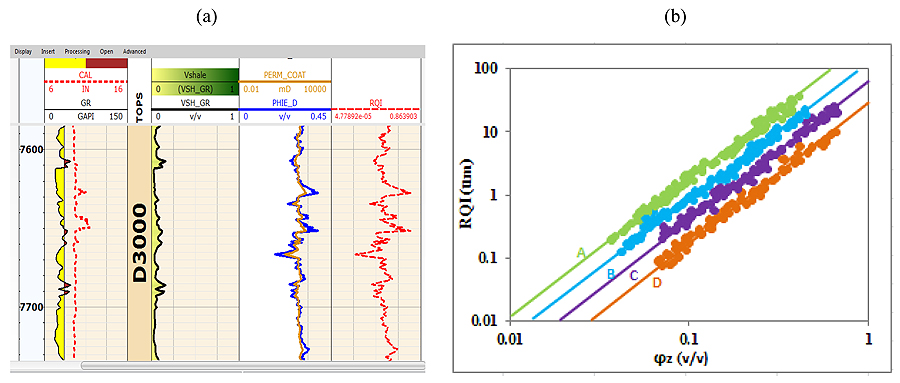
Well PRO6 composed of connected clean sand bodies and consist of four distinct flow units defined within the reservoir. The delineated productive zones for this well are continuously intercalated with little shale sequence. This showed that well PRO6 penetrated the reservoir sands at the point where many flow paths exist. The four flow units delineated exhibits good reservoir qualities as shown in Fig. (6b). This clearly depicts the capacity of reservoir to store and transmit more fluids. Therefore, high hydrocarbon potential is expected. Considering the diagenetic imprint of reservoir X, there is the likelihood of identifying different flow units in well PRO6 relative to the other wells for the same reservoir. The occurrence of four flow units in the reservoir at the point of well PRO6 may be attributed to the high clean sands and little shale barriers observed. Well PRO6 considerably mimic the unique characteristics of the reservoir, exhibiting high reservoir quality with good permeability and porosity profiles. Fig. (6) shows the results of the log interpretation and the reservoir quality plot for well PRO6. Table 4 presents the flow characteristics of the reservoir for well PRO6.
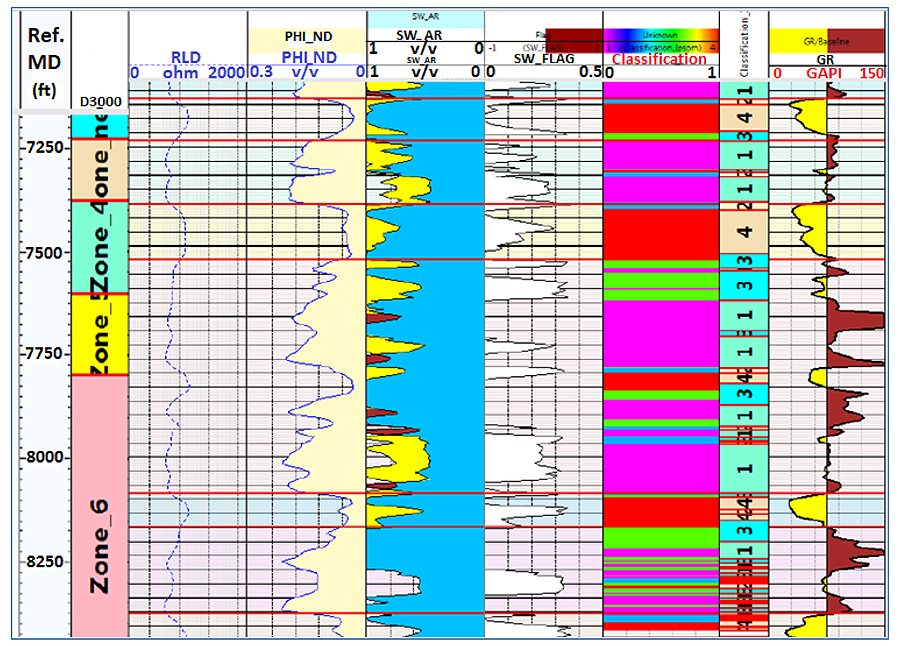
Presented in Fig. (7) is the composite log-view of the various conventional petrophysical logs used in this study.
3.5. Cluster Analysis
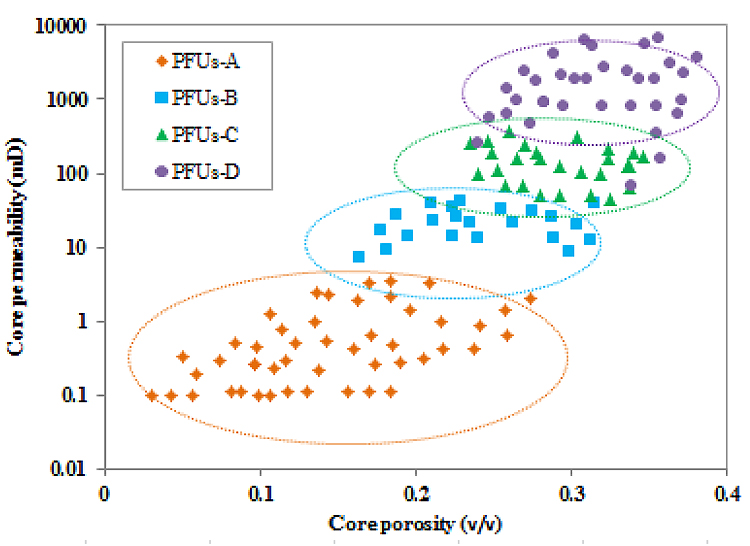
Selecting an appropriate algorithm to predict reservoir properties will produce a good idea of the uncertainty associated with reservoir property distributions and variability of the input data used [18]. In this study, cluster analysis technique was used to predict the distribution of porosity and permeability in reservoir X. Considering this will provide detailed knowledge of the porosity and permeability to describe flow characteristic of the reservoir. Cluster plot of core permeability and porosity was made using the Ward’s analytical type of clustering algorithm. In order to classify the reservoir into different zones for the case study considered, core-derived permeability and porosity from 3 wells (PRO1, PRO3, PRO6) and well log data from 6 wells (PRO1, PRO2, PRO3, PRO4, PRO5, PRO6) were used. The log-permeability values were obtained as an estimate from the log-porosity curves. This is based on permeability-porosity transform in uncored wells/intervals. The available core data from the three active wells (PRO1, PRO3, PRO6) were used as reference to validate the log-permeability and log-porosity. The r35 (pore-throat radius at fluid saturation value of 35%) used in this study is obtained from Winland empirical relation for permeability-porosity determination shown in equation (4). On application of clustering computation, four classifications of paraflow units (PFUs) were obtained for reservoir X.
The different paraflow units showed higher pore throat values for the reservoir as indicated in Table 5. Exponential correlation fitted for the Cluster plot of core permeability versus core porosity in Fig. (8) resulted in coefficient variation (R2) of 0.832 (83.2%). This shows a good relationship between the core samples. The cluster statistical methodology provided better understanding of the reservoir quality, particularly in clastic sediment systems for performance prediction. Fig. (7) presents the composite log-view of the various petrophysical logs used in this study. Fig. (8) shows the cluster plot of permeability versus core porosity for the paraflow unit classification criteria.
| Flow Unit | Gradient | FZI (µm) | HT (µm-2) | R2 | Wells of Occurrence |
|---|---|---|---|---|---|
| A | 2.03 | 22.17 | 20.3E-4 | 0.85 | PRO3, PRO1 |
| B | 2.15 | 17.08 | 3.43E-3 | 0.86 | PRO3, PRO6 |
| C | 2.26 | 12.03 | 6.91E-3 | 0.88 | PRO6, PRO3 |
| D | 2.18 | 10.13 | 9.74E-3 | 0.87 | PRO1, PRO6 |
| Reservoir statistical parameters (Average, Minimum, Maximum) | ||||||||||||
|---|---|---|---|---|---|---|---|---|---|---|---|---|
| Reservoir Properties |
PFUs-A | PFUs-B | PFUs-C | PFUs-D | ||||||||
| Permeability (mD) | 1056 | 213.57 | 2643.55 | 1198.3 | 254.5 | 2342.42 | 1961.0 | 248.8 | 2618.54 | 2106.89 | 348.77 | 3248.87 |
| Porosity (%) | 22.5 | 12.63 | 29.67 | 20.2 | 11.9 | 25.89 | 24.51 | 9.99 | 28.1 | 28.01 | 13.3 | 34.35 |
| r35 (um) | 5.7 | 1.16 | 23.19 | 3.5 | 2.2 | 4.0 | 2.43 | 1.15 | 2.68 | 1.10 | 0.38 | 2.5 |
4. RESERVOIR CHARACTERISATION
Reservoir characterisation is an essential element for describing reservoir heterogeneity. It creates the opportunity to predict the reservoir performance and distribution of rock physical and fluid structures in order to identify the various productive zones in the reservoir for enhanced reservoir description and successful reservoir development projects. Therefore, it is necessary to quantify reservoir heterogeneity to evaluate the reservoir quality and distribution pattern of its properties. More importantly, different techniques have been applied to describe the distribution of reservoir parameters for improved reservoir characterisation. Abraham et al. [19] proposed spatial based modeling approach to evaluate horizontal well performance taking into consideration the influence of horizontal well length and permeability anisotropy. For this research, spatial distribution of reservoir properties for evaluation of flow units is the focal point. Conditional simulation was used to describe the lateral changes in properties for the reservoir investigated. The permeability, porosity, pressure and oil saturation are estimated at well locations for flow unit characterization.
4.1. Property Modeling
Property modeling describes the process of filling the cells of the grid with discrete (facies) or continuous (petrophysics) properties [20]. Over the years, the use of geostatistics and stochastic modeling has emerged as unique approaches to integrate different data sources for enhanced reservoir description [21]. Despite the use of stochastic simulation, integrating geological and petrophysical data can simulate production performance [22].In this research, geostatistical modeling technique, specifically gaussian simulation method was used to model the reservoir properties. 2D grid model of the reservoir was built to populate these properties stochastically. This was ascertained by integrating available well log and core data. The dataset was calibrated with core data, validated and scaled up. The various property values from the calibrated log data were scaled up such that each grid cell was assigned a single value for each property to be modeled into two-dimensional space. A cell size of 100 x 100x 20 was selected to construct the grid model which captured the details of reservoir X.
2D maps were generated for permeability and porosity using the gaussian simulator. The permeability, porosity, pressure and saturation were distributed in the grid to reflect their spatial variability in the reservoir. The property distribution modeling for porosity and permeability for the reservoir began by constructing a series of variograms from selected sampled data points. Experimental variograms and corresponding modeled variograms were also constructed for these properties. The best fit data points of each variogram models for the properties considered were chosen for reservoir simulation studies.
In addition, the pressure and oil saturation distribution for the reservoir flow units were also mapped. Sensor6K simulator was used to generate 2D maps to enhance visualisation of pressure and saturation distribution for the flow layers of the reservoir X. The spatial distribution maps generated captured the variability of the reservoir properties for the case study considered. The modeling technique provided the means for better understanding of the spatial distribution of discrete and continuous reservoir properties to investigate the production behaviour of reservoir X.
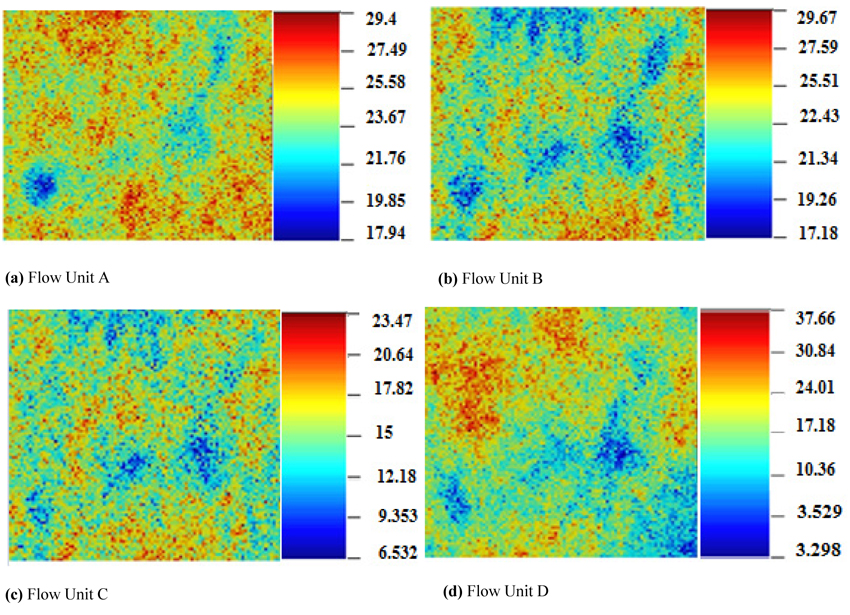
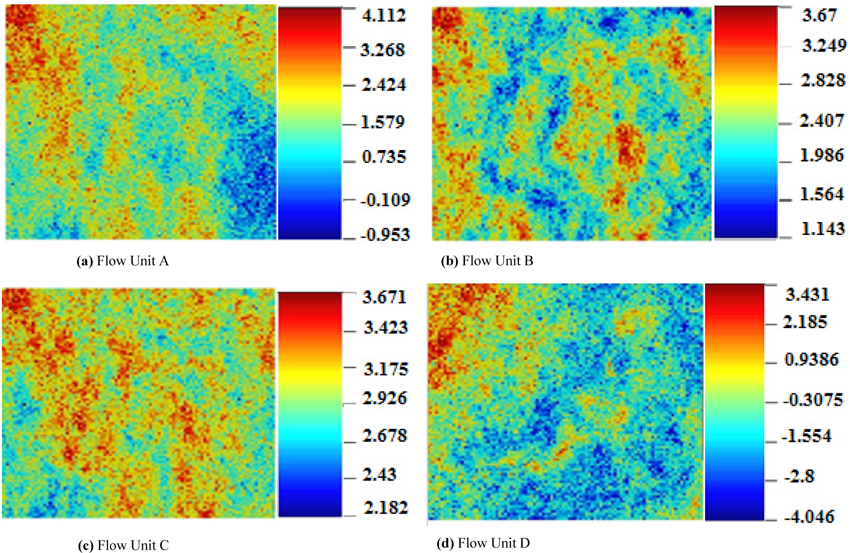
4.2. Porosity and Permeability Distribution Model
The estimation of porosity and permeability is important for the oil industry and a lot of research goes into estimating these petrophysical properties from subsurface data [23]. For this research, stochastic simulation was carried out using the gaussian simulator-SGEMS to quantify the lateral distribution of reservoir permeability and porosity for the flow units defined. Four realistic descriptions of reservoir porosity and permeability were generated. Sequential Gaussian Simulation (SGSIM) was carried on porosity whilst permeability was generated from Sequential Indicator Simulation (SISIM). The permeability distributions for the reservoir are presented in their respective log values. Estimated values of porosity and permeability obtained from variogram computations and descriptive statistics were used to populate the reservoir porosity and permeability. The SGSIM and SISIM algorithms were conditioned to generate realistic descriptions of these properties at unsampled locations as shown in Figs. (9 & 10). Analyses of the spatial distribution of permeability and porosity from the simulated maps revealed higher values for the flow units of reservoir X. The average simulated permeability and porosity in the reservoir units ranged between 9.99% -36.39% and 248 mD - 4688 mD, respectively. This shows that the reservoir has very high capacity to transmit and store fluids. The porosity and permeability distribution increased towards the northwest and southeast portion of the reservoir units and eventually decreased towards the central portion of the reservoir units.
| Property | Flow Unit A | Flow Unit B | Flow Unit C | Flow Unit D | ||||||||
|---|---|---|---|---|---|---|---|---|---|---|---|---|
| Average | Min. | Max. | Average | Min. | Max. | Average | Min. | Max. | Average | Min. | Max. | |
| Porosity (%) | 23.1 | 16.9 | 28.0 | 22.3 | 15.2 | 25.7 | 26.4 | 11.5 | 23.67 | 24.5 | 13.5 | 33.0 |
| Permeability (mD) | 1013.2 | 314.2 | 3505.4 | 1817.3 | 453.1 | 2169.5 | 2219.7 | 683.6 | 2963.3 | 1305.4 | 249.4 | 1989.4 |
Considerably, distribution of both properties showed high spatial continuity and significant variations. Permeability values for flow units ABC and D peaked at 3505.4 mD, 2169.5 mD, 2963.3 mD and 1989.4 mD, respectively. The highest porosity values are observed for flow unit D whereas flow unit A exhibit the highest permeability values for reservoir X. Table 6 shows the summary of statistical analysis for permeability and porosity. The geostatistical approach adopted enhanced the prediction of the reservoir porosity and permeability with reduced uncertainties.
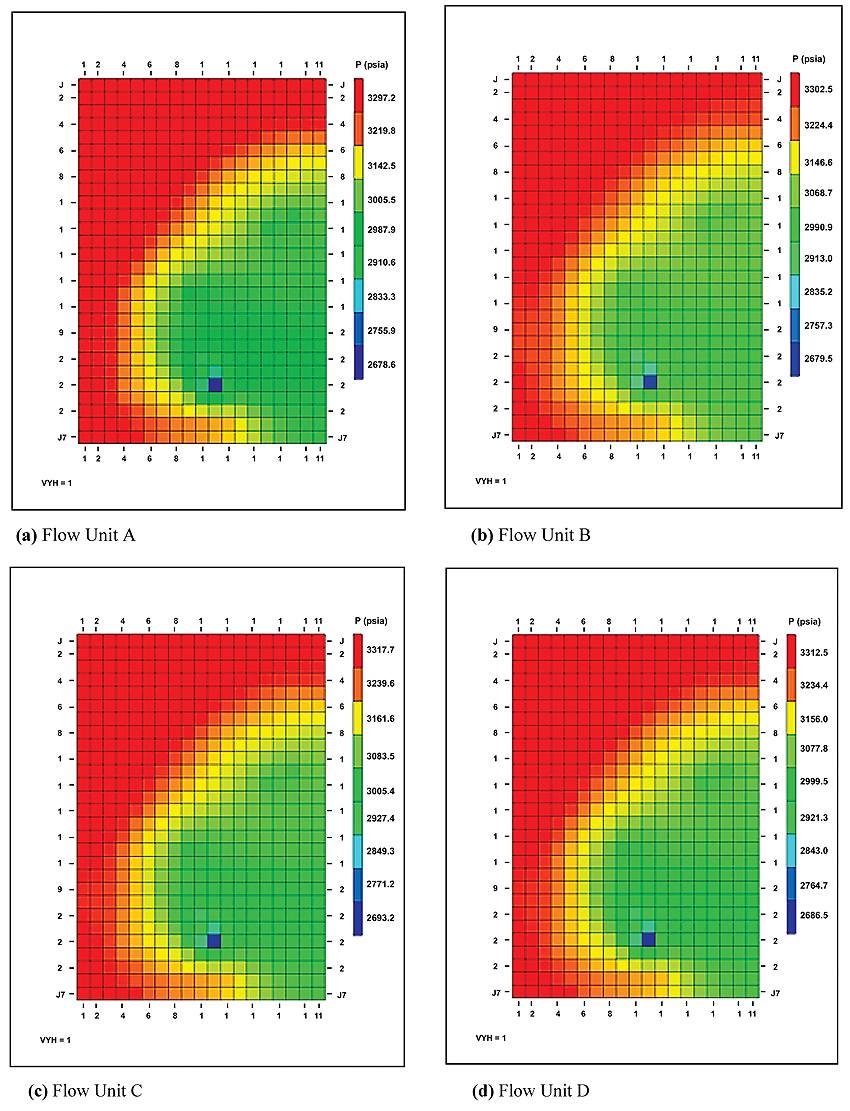
4.3. Pressure and Saturation Distribution Model
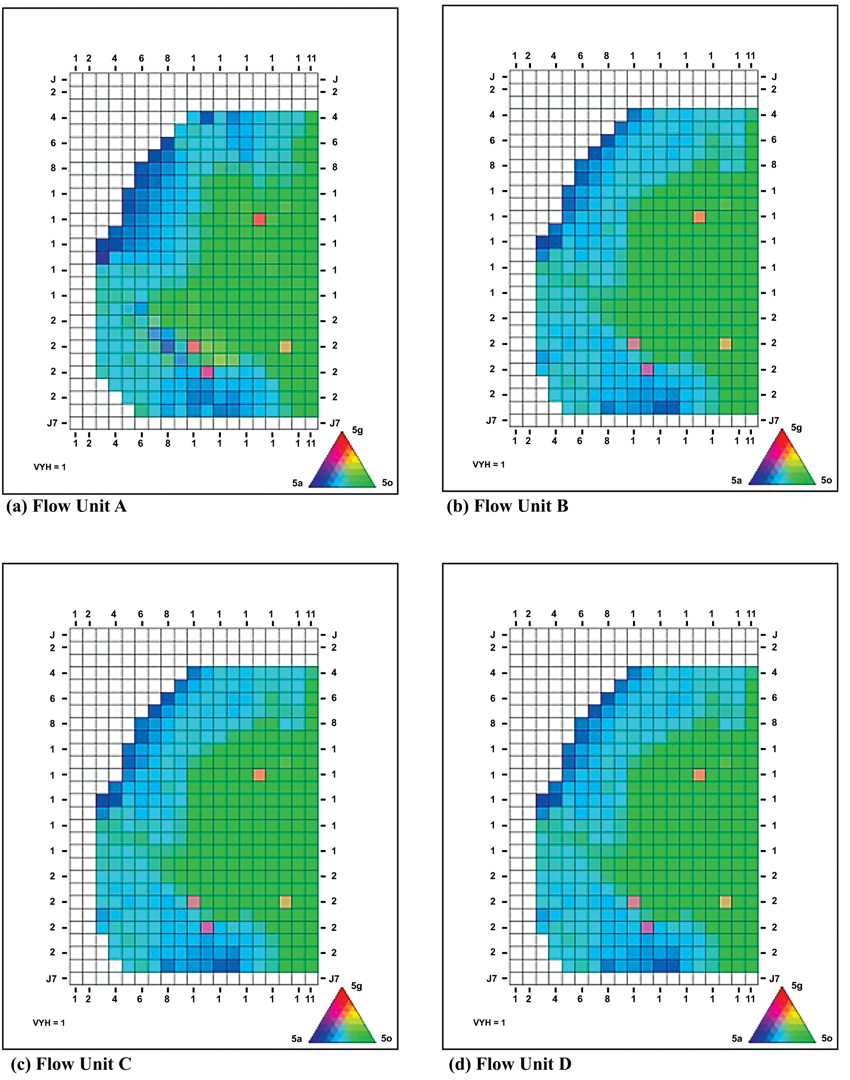
The pore volumes of the grid blocks and inter-block transmissibilities used for generating the pressure and oil saturation distribution maps were estimated by Sensor6K simulator. The various flow units ABC and D defined for reservoir X revealed high oil saturation and pressure distributions. The pressure and saturation is distributed uniformly within the flow units delineated. Flow units ABC and D had maximum pressure distribution values of 3297.2 psi, 3302.5 psi, 3317.7 psi and 3312.5 psi, respectively. This indicated an excellent pressure communication between the interwell locations where the various flow units exist. The pressure distribution for the flow units of reservoir X ranged between 2600 psi and 3317.7 psi whereas the oil saturations ranged between 11% and 47%. Flow unit C recorded the highest pressure value of 3317.7 psi and the minimum pressure of 2678.6 psi observed for flow unit A. The maps indicated in Figs. (11 & 12) preserved the spatial variations of pressure and saturation distributions across the flow units of reservoir X. Table 7 shows the summary of the statistical analysis for pressure and oil saturation.
| Property | Flow Unit A | Flow Unit B | Flow Unit C | Flow Unit D | ||||||||
|---|---|---|---|---|---|---|---|---|---|---|---|---|
| Average | Min. | Max. | Average | Min. | Max. | Average | Min. | Max. | Average | Min. | Max. | |
| Oil Saturation (fraction) |
0.27 | 0.13 | 0.38 | 0.24 | 0.15 | 0.40 | 0.28 | 0.17 | 0.45 | 0.23 | 0.11 | 0.47 |
| Pressure (psi) | 3113.2 | 2678.6 | 3297.2 | 3017.3 | 2679.5 | 3302.5 | 3289.7 | 2693.2 | 3317.7 | 3305.4 | 2686.5 | 3312.5 |
4.4. Model Initialisation, History Matching and Prediction
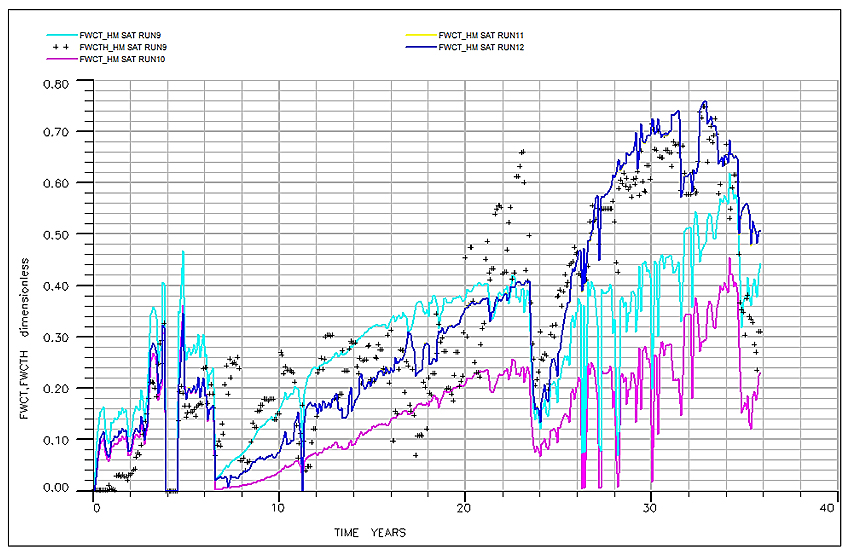
The construction of reservoir simulation models requires the common knowledge of flow unit identification to describe the dynamic properties of reservoirs [24]. For this research, eclipse 300 black-oil reservoir simulator was used for the dynamic simulation stage. Dynamic models were built for oil saturation constrained to Field Water Cut (FWCT), Field Gas-Oil Ratio (FGOR) and Total Field Water Produced (FWPT) to predict the production behaviour of the field. The models were initiated for simulation considering 40 years of production period. Dynamic field data was incorporated into the models and history matching was performed to evaluate the reservoir production characteristics. The proposed models for the field were calibrated by adjusting the input parameters such as pore volume, relative permeabilities, among others and running eclipse black-oil simulator with historical injection and pressure data. FWCT, FWPT and FGOR profiles obtained from the history matching during the production period were analysed to evaluate behaviour of the field. Fig. (13) presents the simulated history matched model of field water cut for reservoir X.
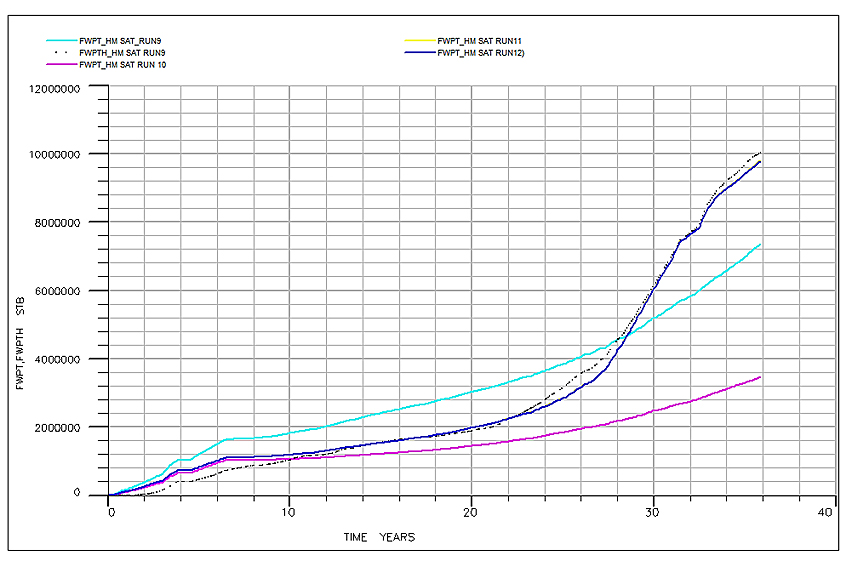
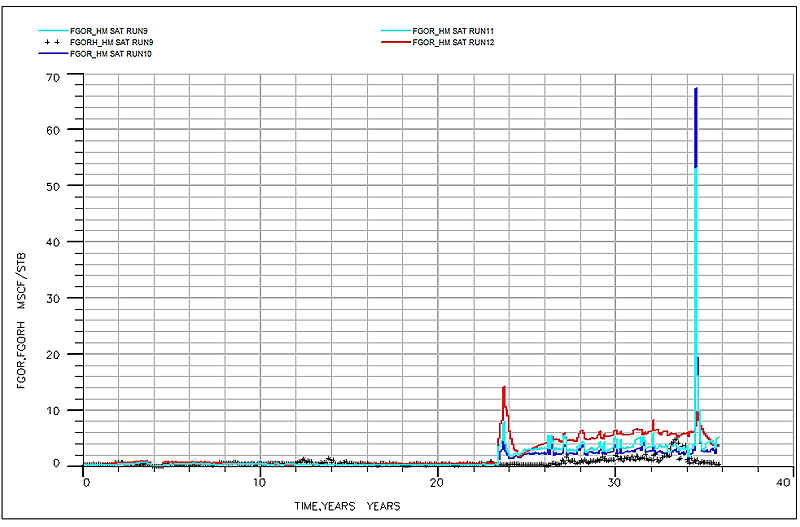
The results obtained from the various simulation runs were compared with field data to determine whether it could describe the actual reservoir performance. The properties of reservoir X across the field of interest showed similar results after the adjustment of input parameters for history matching and prediction. Thus, the calculated (model) and observed field data revealed similar trend for the reservoir indicating an appreciable match. The simulated models for the field produced an average FWCT of 78.9%, FWPT of 10 MMSTB and high FGOR of 6.8 MSCF/STB, respectively. The results showed an increase in water production with increasing gas-oil ratio over the production period. The high FGOR achieved could be attributed to pressure depletion due to continuous oil production from the reservoir X. Because the reservoir energy is primarily an aquifer influx, early water breakthrough could be encountered for a longer time during continuous production. For this reason, there should be a shut-in period to build up the pressure in reservoir X, particularly when water cut exceeds the field recovery limit. In this case, economic profitability should be considered very important, especially when there is the need to optimize production for future performance prediction of the field. This necessitated the need for integrated approach to characterise the reservoir of interest so as to provide detailed description to maximize oil recovery at optimum gas-oil ratio and water cut. Figs. (14 & 15) present the simulated history matched models of total field water produced and field gas-oil-ratio for reservoir X.
5. DISCUSSION OF RESULTS
The reservoir of interest is confined to complex pore structure and inherits lateral and vertical variations in properties. The intrinsic complexities of the reservoir associated with latter geological interruptions and incoherent depositional setting make the reservoir heterogeneous. The complex nature of the reservoir units makes it challenging to delineate possible flow units for what will happen in future development. It poses difficulties to petroleum engineers and geoscientists to model and predict the reservoir performance using conventional petrophysical methodologies. Bearing in mind the complex heterogeneity of the reservoir, there is the need for detailed reservoir description to provide reliable information on the reservoir properties. This necessitated the use of integrated reservoir characterisation methodology. Oladipo [25] suggested that integration of subsurface data could lead to building of reliable reservoir models that can provide basis for effective reservoir management strategy. In this study, integrated approach was used for enhanced reservoir description and performance evaluation of the field.
Division of the reservoir into significant flow units facilitates description of geologic, physical properties and depositional environment that affect fluid flow [26]. This suggests that flow unit delineation is an essential aspect of reservoir characterisation process. Therefore, to better understand the reservoir flow potential, cluster analysis from Ward’s analytical algorithm was used to classify the entire reservoir into four paraflow units. The flow units defined are described by wide range of porosity and permeability values indicating good flow and storage potential for reservoir X. In addition, analyses of spatial distribution of properties were performed. The property distribution modeling performed for reservoir porosity, permeability, pressure and oil saturation captured the spatial variability of these properties at well locations for delineated flow units.
The use of well log data in petrophysical analysis has always been crucial for identification and assessment of hydrocarbon bearing zones [27]. However, it is interesting to note that detailed reservoir quality evaluation was carried out for this research. The evaluation revealed four distinct flow units defined within consistent clean sand zones based on RQI method. The quality of reservoir defines hydrocarbon storage capacity and deliverability as well as the effective porosity and permeability [28]. Results from the petrophysical analysis showed that the reservoir is generally characterised by continuity of clean sands intercalated with shale sequence for the interval considered.
Taking into consideration the diagenetic effects of the reservoir, it is established that both moderate and good sand quality (facies) were observed. There is the existence of low and high shale baffles within dirty sand zones acting as permeability barriers for the flow units delineated. The flow units varies from one well to another within the relatively thin reservoir.
Comparatively, four flow units were delineated for well PRO6 and well PRO1 having three flow units, respectively. Well PRO6 had the highest number of flow units because it penetrated the reservoir at the point where many flow paths exist. Therefore, the highest amount of hydrocarbon is expected from this well in the reservoir. Two flow units were identified for well PRO3. It is observed that the reservoir quality deteriorates significantly with increasing depth. There could be the possibility of flow unit truncations in the reservoir at deeper depth.
Moreover, history matching was performed to evaluate field performance. The history match process described the field behaviour. It showed appreciable match between the calculated and observed/history data. It also provided average FWCT, FWPT and FGOR needed to achieve optimum recovery from reservoir X. Conclusively, it can be stated emphatically that integrated reservoir characterisation technique is an efficient tool for predicting the production behaviour of complex clastic systems.
CONCLUSION
Based on the study conducted on the reservoir, the following conclusions were made:
The integrated methodology used in this study demonstrated an excellent ability to quantify complex clastic reservoirs by providing better understanding to predict and investigate production behaviour of the reservoir.
The RQI method used for the flow unit characterisation has established potential flow paths of hydrocarbon fluids during production and the best intervals for perforation.
The Ward’s analytical algorithm adopted in this study classified the reservoir into four distinctive paraflow units characterised by high values of porosity, pore throat radius and permeability.
The conditional simulation method showed effectiveness of using geostatistical techniques for characterising heterogeneous clastic systems. It quantified the uncertainties in the prediction of reservoir porosity, permeability, oil saturation and inter-well flow unit pressure. It also captured the spatial variations of these properties within the flow units delineated.
Results from the dynamic simulation for the history matching and prediction demonstrated the efficiency of the proposed models to evaluate performance of the reservoir X investigated.
CONSENT FOR PUBLICATION
Not applicable.
AVAILABILITY OF DATA AND MATERIALS
The data for the findings is a real field data obtained from Elf Exploration and Production Limited but for confidential reasons (to avoid jurisdictional claims), we cannot share the data.
FUNDING
None.
CONFLICT OF INTEREST
The authors declare no conflict of interest, financial or otherwise.
ACKNOWLEDGEMENTS
The authors appreciate the All Nations University College (ANUC), Koforidua for the supports granted them to complete this work. Also acknowledged are Professor Djebbar Tiab of the University of Oklahoma, United States of America, Miss Mavis Acheampong of Assistant Family Group of Companies, Italy and Schlumberger for donating the TECHLOG and ECLIPSE application suites used for this research.