All published articles of this journal are available on ScienceDirect.

Microrespirometric Validation of a Two-stage Process for Polyhydroxyalkanoates Production from Peanut Oil and Propionate with Cupriavidus necator
Authors Info & Affiliations
Abstract
Introduction
Poly(3-hydroxyalkanoates) (PHA) is a biodegradable polyester synthesized by various bacteria, including Cupriavidus necator. The composition of PHA is influenced by the type of microorganism, cultivation conditions, and carbon substrate. The selection of a carbon source is critical for PHA production, significantly impacting process costs. Therefore, the common goal is scalability, with the design and optimization of PHA production relying on experimental determination of constitutive parameters.
Methods
In this work, a two-stage process for PHA production was conducted in shaking flasks functioning as mini reactors with the bacteria Cupriavidus necator. During the first stage, fructose was used as the sole carbon source. Once fructose was exhausted, a second stage commenced with a new carbon source, either peanut oil or propionate, to enhance PHA production. Ex-situ pulse respirometry approach was employed during the two-stage process to follow the kinetics of substrate consumption.
Results
The results indicated that the use of peanut oil would be advantageous over propionate, resulting in 12.2% more biomass and 13.9% more PHA.
Conclusion
Additionally, the growth rate was 88.9% higher with peanut oil. The characterization by pulse respirometry applied in microreactors, i.e., micro respirometry, allowed for the performance of up to 216 biological experiments to determine four important kinetic and stoichiometric parameters, namely maximum oxygen uptake (rO2max), substrate affinity constant (KS), growth yield (YX/S), and substrate oxidation yield (YO2/S). The values of these parameters indicated that peanut oil would be the best carbon source to promote PHA production during the second stage. The implementation of the microrespirometry technique during the screening of carbon sources for PHA production provided reliable information within a short period and with significantly less experimental effort.
1. INTRODUCTION
Poly(3-hydroxyalkanoates) (PHA) is a biodegradable and biocompatible polyester, which is synthesized by a high number of microorganisms, specifically bacteria such as Pseudomonas sp., Delftia sp., Cupriavidus sp., Bacillus sp., Escherichia coli, Rhodobacter sp. and more [1]. PHA is biodegradable in the sense that microorganisms in their natural niche can degrade it through the action of enzymes, i.e., hydrolases and depolymerases. The time for PHA degradation varies from a couple of months up to several years, depending on the environmental conditions. It has been reported that PHA composition depends principally on the type of microorganism, cultivation conditions and carbon substrate employed [2]. PHA is typically accumulated as a carbon and energy reserve under adverse environmental conditions [3]. In this context, PHA is produced due to the limitation of phosphorous, nitrogen, or oxygen in the environment, coupled with an excess of carbon source. Essentially, within a microbial response to stress, one of the advantages exploited by the industry is PHA accumulation [4]. The selection of a carbon source is of paramount importance for PHA production as a significant portion of the process cost relies on the carbon feedstock for bacterial growth, often accounting for 50% of the total production cost [5, 6]. Therefore, various types of carbon sources have been used as substrates to improve PHA production, and agricultural by-products such as vegetable oils or molasses have been preferred due to their low cost [6]. In particular, the high content of saturated fatty acids in peanut oil can lead to the production of a novel PHA with a low melting temperature, high permeability rates and a high elongation at break in comparison with other biopolymers. This characteristic could be useful for food packaging applications [7]. Additionally, the utilization of volatile fatty acids, such as propionic acid, to produce PHA has been proposed as an important and low-cost carbon source [8]. Regardless of which carbon source is used to produce PHA, there is a common objective, which is the scalability of the process based on a pre-defined carbon source [9, 10]. The design, control, and optimization of a given PHA production process depend on the experimental determination of the constitutive parameters of the process, traditionally carried out using analytical techniques based on the measurement of the process-limiting substrate. These traditional techniques are laborious and require a significant investment of materials, time, and human resources [11]. Therefore, it is important to develop tools that allow (i) selecting an adequate carbon source for PHA production and (ii) accurately determining kinetic and stoichiometric parameters for scaling-up purposes. In this sense, respirometry has been proposed not only to evaluate the kinetic parameters of biomass but also to monitor them and provide quality data for mathematical modeling [12]. Respirometry is the measurement of the biological oxygen uptake rate (rO2) to oxidize organic matter under well-defined conditions. This technique represents an alternative for parameter estimation compared to traditional techniques (based on the measurement of substrate concentration) because the dissolved oxygen (DO) concentration can be easily measured online with a DO probe. This results in a lower contribution in terms of experimental work, and in addition, high-quality data can be obtained in less time [11].
In this work, the intention was to use ex-situ pulse microrespirometry as a faster and more reliable method to characterize a two-stage process with a pure culture of C. necator for PHA production, transitioning from fructose to sodium propionate or peanut oil. Changes in biomass concentration, growth rate, and PHA production were monitored using microrespirometry and standard protocols. However, it is noteworthy that the culture's affinity for fructose, peanut oil, and sodium propionate was tracked simultaneously throughout the entire experiment solely using microrespirometry.
2. MATERIALS AND METHODS
2.1. Microorganisms and Culture Media
Cupriavidus necator (ATCC 17699) was maintained in a pre-culture medium. The pre-culture medium was done in 100 mL of modified LB medium containing tryptone (10 g / L), NaCl (10 g L-1), fructose (10 g L-1) and yeast extract (5 g L-1) during 24 h at 30ºC and 150 rpm. Additionally, 2.5 mL of the pre-culture was used to inoculate four Erlenmeyer flasks (minireactors) that were previously filled with 250 mL of culture media containing fructose (7.5 g L-1), (NH4)2SO4 (1.884 g L-1), NaH2PO4 H2O (1.392 g L-1), KH2PO4 (0.9 g L-1), MgSO4 7H2O (0.12 g L-1), CaCl2 2 H2O (6 mg L-1), FeSO4 7H2O (12 mg L-1) and trace mineral solution (0.6 mL L-1). The pH of each mini reactor was adjusted to 7 with a solution of NaOH 2M, and then the mini reactors were placed into an incubator with orbital shaking (Lab companion SI-600R) at 30°C and 150 rpm. Culture samples from the mini reactors were taken at hours 12, 21, 33 and 36 of setting the cultures to establish the status of the fructose, biomass, ammonium and PHA concentrations, and these samples were used during micro respirometric experiments as well.
2.2. Two-stage PHA Production
The strategy for PHA production in the four mini reactors follows a two-stage process. During stage one, C. necator was adapted under batch culture conditions at an initial C/N of 7.6 using fructose as the carbon source. Then, at stage two, when the fructose was exhausted, a new carbon source was added to the minireactors as follows: two of the minireactores were supplemented with vegetable oil (peanut oil), while the remaining mini- reactors were supplemented with sodium propionate. The amount of peanut oil and sodium propionate added to the mini reactors corresponded to a final concentration of 0.2% w/v.
2.3. Microrespirometric Characterization and Data Interpretation
The experimental strategy followed during micro respirometric experiments consisted of the kinetic and stoichiometric characterization of several samples taken from the mini reactor at different cultural stages. Biomass characterization of each sample was carried out by analyzing and interpreting the DO concentration-response changes in the presence of a given concentration of each substrate tested: fructose, sodium propionate or peanut oil. This characterization was performed following a respirometric protocol based on the adapted dynamic pulse respirometry method to a microreactor system, i.e., micro respirometry [13]. The description of the microreactor system used in this work was previously described [13-15]. Briefly, the microreactor system consisted of two unbaffled 24-well (16 mm diameter, 18 mm depth, 3 mL total volume) microflask systems (OxoDish24, PreSens, México). Each well included a pre-calibrated fluorometric dissolved oxygen (DO) sensor (OxoDish, PreSens, Mexico). The DO sensors were read with a 24-channel Sensor Dish Reader (SDR-281, PreSens, Mexico) connected to a personal computer for data acquisition using the PreSens software (SDR v37). The microreactor system was an orbital shaker with temperature control. The orbital shaker served to provide oxygen by superficial aeration from the air present in the headspace of each well and from the gas exchange between the headspace and the atmosphere. Furthermore, a glass bead (5 mm diameter) was introduced into each well to improve mixing and mass transfer. Traditional dynamic pulse respirometry consists of an online measurement of the DO concentration after the addition of a pulse of a given substrate concentration (fructose or sodium propionate or peanut oil) under continuous aeration. In this study, the dynamic pulse respirometry method was applied to the microreactor system as follows: (i) Each well of the two unbaffled 24-well microflask was filled with 1.4 mL of a suspension of biomass obtained from the minireactors and operated until each well reached a steady-state DO concentration (ii) A pulse of 0.1 mL of a diluted substrate stock solution corresponding to different concentrations was given: 25, 50, 75 and 100 mg COD L-1, each concentration was tested by triplicate including a control experiment in which no substrate was added (iii) The DO concentration was measured until it returned to the previous steady state. As the microreactor system has 24 wells, it was possible to inject up to four different concentrations of a given substrate in duplicate during one experiment. In that way, it was possible to apply the dynamic micro respirometric pulse technique with increasing concentrations of a given substrate: 25, 50, 75 and 100 mg L-1 that allowed retrieving several kinetic and stoichiometric parameters of importance during PHA production [16]. Prior to the micro respirometry experiments, the biomass suspension was prepared as follows: 75 mL taken from the mini reactors were centrifuged at 7000 rpm and 25°C for 15 min (Eppendorf AG, Germany), then the supernatant was removed, and the remaining biomass was mixed with 75 mL of the culture media avoiding the addition of any carbon source. Three substrate stock solutions were used, containing separately 1500 mg of fructose L-1, 1000 mg of sodium propionate L-1 and 1000 mg of peanut oil L-1. The stock solutions were diluted to the desired final concentration in the microreactors prior to the micro respirometric experiments. The solution containing the peanut oil was homogenized by mixing at 10,000 rpm for 10 min (Polytron PT2500 E, Kinematica) before its use in micro respirometry experiments. The COD values of the substrate stock solutions were characterized through triplicate measurements of the chemical oxygen demand (COD), determined by the closed reflux colorimetric method according to standard methods [17].
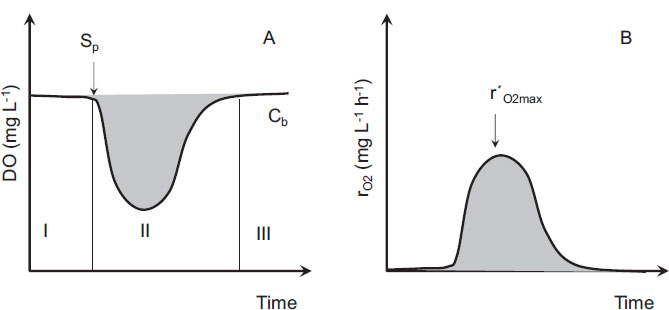
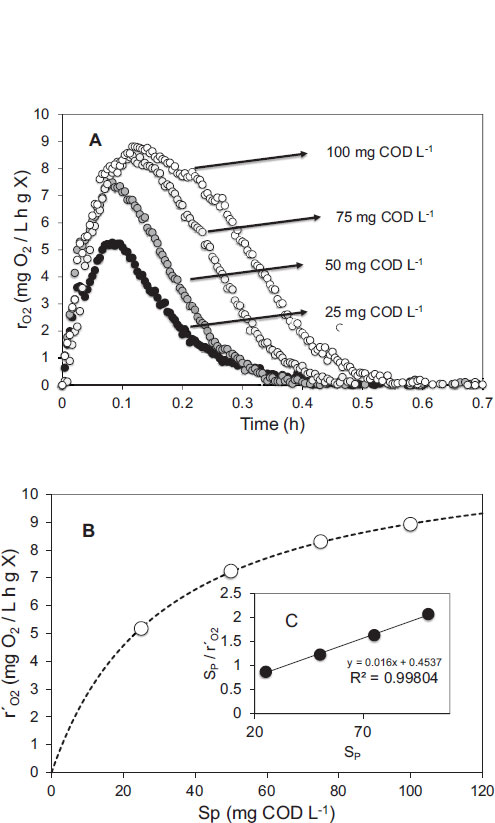
Once the samples were prepared and placed into the microreactors, the agitation was started, and the DO reached a maximum concentration called baseline DO that corresponds to the endogenous respiration of the microorganism (Cb) (Fig. 1A, area I). In addition, a substrate pulse of a given concentration (SP) was injected, and a change in the DO concentration provoked by the biological oxidation process was observed (Fig. 1A, area II). After the consumption of the substrate, the DO returned to its previous value of Cb (Fig. 1A, area III).
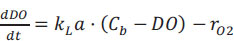
The DO concentration in Fig. (1A) can be described by an oxygen mass balance between the observed exogenous oxygen uptake rate (rO2) and the O2 provided by continuous superficial aeration (Eq. 1).
 |
(1) |
The volumetric oxygen transfer coefficient (KLa) was determined with the dynamic method as follows. Firstly, N2 was sparged into the two unbaffled 24-well microflask systems that were previously placed into the orbital shaker incubator. Ninety percentof O2 was removed from the microreactor system, the N2 flow was stopped, and the DO concentration started to increase until saturation. DO data obtained during the O2 saturation stage were used to solve Eq. (2) with the KLa as the fitting parameter in ModelMaker® software (Cherwell Scientific, UK) using the 4th-order Runge-Kutta method and the Levenberg-Marquardt optimization.
 |
(2) |
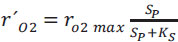
The DO curve (Fig. 1A) can be transformed into a rO2 curve with Eq. (1) (Fig. 1B). The value of the observed maximum oxygen uptake rate (r´O2max) for each pulse was determined from the average of the ten highest values of the respiration rate observed in the respirogram at a given value of SP. Then, the r´O2max values obtained were plotted against the SP values, and, will be discussed in the “Results and Discussion” section, the resulting graphs showed a clear Monod-type shape. Therefore, two important kinetic parameters were determined, namely, the substrate affinity constant (KS, mg L-1) and the maximum oxygen uptake rate (rO2 max, mg O2 L-1 h-1), following a Monod model for the C. necator growth in the presence of a given substrate concentration (SP) (Eq. 3).
 |
(3) |
The two parameters KS and rO2 max, were determined after Hanes Woolf linearization of Eq. (3) (Eq. 4).
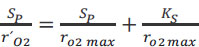 |
(4) |
Finally, the substrate oxidation yield (YO2/S) and the biomass yield (YX/S) were calculated following Eq. (5), which represents the growth on a carbon source, such as fructose, of a given heterotrophic microorganism.
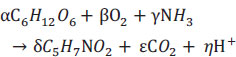 |
(5) |
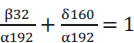
When Eq. (5) is expressed in terms of chemical oxygen demand units, which represent the oxygen required for complete oxidation, only the factors associated with fructose, oxygen, and biomass are taken into consideration. Consequently, the terms NH3, CO2 and H+ are excluded from the equation, given their chemical oxygen demand is zero. Furthermore, the excluded terms arethen substituted into Eq. (5), resulting in the values of 192 g O2 mol-1 C6H12O6), 32 g mol-1 O2) and 160 g O2 mol-1 C5H7NO2, respectively. This modification transforms Eq. (5) into Eq. (6).
 |
(6) |
By rearranging Eq. (6), we get:
 |
(7) |
The first term represents the mass of oxygen consumed per unit of glucose consumed, that is, YO2/S, and the second term represents the mass of biomass produced per mass of glucose consumed, this is YX/S. Therefore, we can formulate the following equation:
 |
(8) |
Both stoichiometric parameters were determined by using Eq. (9) in which the amount of DO consumed during a substrate pulse injection was calculated through the integration of the grey area of Fig. (1A).
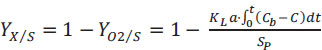 |
(9) |
The same procedure was applied when peanut oil and sodium propionate were used as a carbon source during respirometric experiments.
2.4. Analytical Procedures
The liquid content of a mini reactor was divided into several samples: 75 mL was used for micro respirometric assessment, 30 mL was used for biomass, fructose, and ammonium quantification, and the remaining was used for PHA quantification. According to APHA [17], biomass concentration on the flasks was measured by dry weight. The fructose and ammonium concentrations were measured by the dinitrosalicylic acid method [18] and Weatherburn methodology [19], respectively. Gas chro- matography (SRI Instruments 310, USA) was carried out with an AT-WAX capillary column (Alltech, Deerfield, IL, USA). PHBV (88:12, Goodfellow®) was used as standard. The hydroxybutyrate (HB) and hydroxyvalerate (HV) concentrations were determined using a 50 mg / mL stock solution of derivatized (by propanolysis) PHBV standard.
2.5. Statistical Analysis
Variations in the kinetic and stoichiometric parameters (YO2/S, YX/S, KS, and μmax) were compared using the Tukey-Kramer test performed after analysis of variance (α = 0.05) using NCSS 2001 software. The dissolved oxygen data obtained from respirometric experiments were softened by a standard 7-point smooth function.
3. RESULTS AND DISCUSSION
3.1. Two-stage PHA Production in Shaking Flasks Followed by Standard Methods
The whole two-stage production of PHA took place during 48 h, and the experiment was performed in triplicate. During the first stage of approximately an average of 36 h, the initial fructose concentration was nearly exhausted (less than 0.84 ± 0.21 g L-1), and the total biomass concentration attained was 5.83 ± 1.33 g L-1, corresponding to a growth yield of 0.5 gX gS-1. The dotted vertical lines, as illustrated in Fig. (2), represent the exponential growth phase of the batch culture occurring between hours 12 and 36. During this period, the biomass productivity was 0.15 ± 0.02 g L-1 h-1 and the substrate degradation rate was 0.24 ± 0.03 g L-1 h-1. The ammonia was approximately reduced to half the initial value after 36 h. Regarding the PHA concentration, an initial value of 0.6 ± 0.2 g L-1 was detected at the beginning of the experiment, then, the PHA concentration oscillated during the first 36 h in which it reached a maximum value of 3.98 ± 1.11 g L-1 was detected at hour 21, followed by a slight decrease to 2.664 ± 0.022 g L-1 at hour 36. The oscillating values of PHA, as depicted in Fig. (2C and 2D), have been previously noted by several authors [2, 7]. These fluc- tuations may be attributed to the intrinsic nature of the unsteady state in batch cultures, reflecting the complex and dynamic progression of biomass growth through distinct phases, including lag, exponential growth, stationary, and decline.
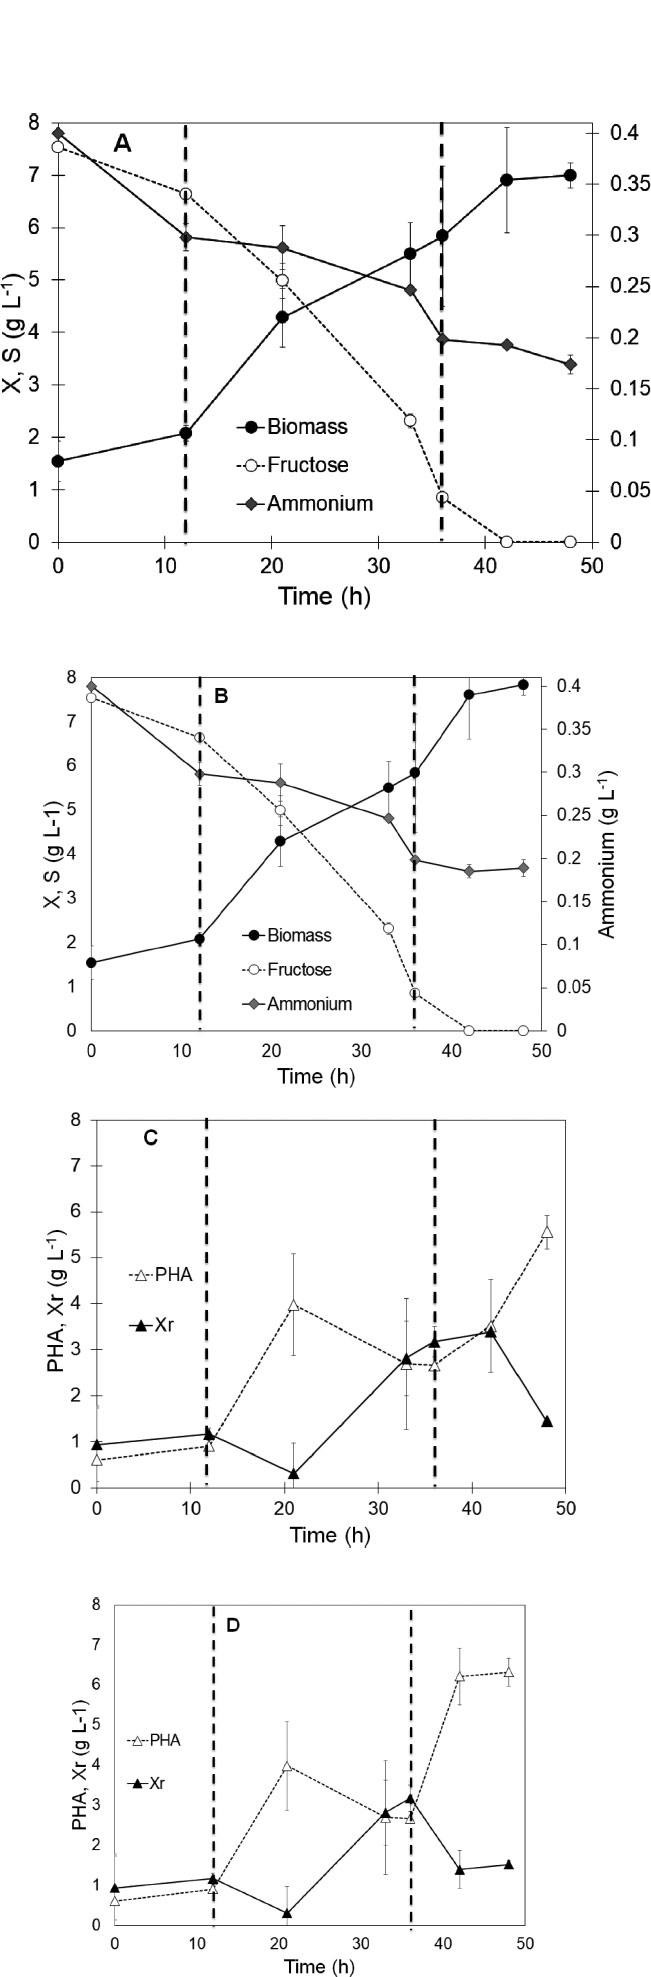
After 36 h, the second stage was started, sodium propionate (Fig. 2A) or peanut oil (Fig. 2B) was added to the mini reactors, and the culture was continued for a further 12 h. During the second stage, the fructose concentration was completely exhausted, and the ammonium was still dropping but at a lower rate than in the previous first stage, as shown in Fig. (2). Between hours 36 and 48, there was an increase in the total biomass ranging from 5.84 ± 1.34 g L-1 to 6.99 ± 0.24 g L-1 with sodium propionate and from 5.84 ± 1.33 g L-1 to 7.84 ± 0.24 g L-1 with peanut oil. The growth rate observed during the first stage with fructose was 0.12 g L-1 h-1. In the second stage, the introduction of sodium propionate led to a reduction in biomass productivity to 0.09 g L-1 h-1, representing approximately 60% of the biomass productivity achieved during the exponential phase of the first stage in the presence of fructose. On the other hand, the culture in the presence of peanut oil presented a higher growth rate up to 0.17 g L-1 h-1, which was even 13% higher than the rate observed during the exponential phase with fructose. Although C. necator was able to use both new carbon sources once fructose was exhausted, it was observed that the culture supplemented with peanut oil had higher biomass yields. The utilization of sodium propionate as a sole carbon source can lead to an inhibitory effect on biomass growth since it is a volatile acid. It has been reported that a concentration superior to 1 g L-1 of propionic acid can lead to significant toxicity in the culture media [5]. Nevertheless, when an inferior concentration of sodium propionate (0.2% w/v) was used, an inferior growth of C. necator was observed compared with the culture with peanut oil.
According to Fig. (2B), the highest value of PHA concentration was obtained with peanut oil (6.32 ± 0.35 g L-1) against sodium propionate (5.55 ± 0.35 g L-1). However, it is important to note that the composition of the total biomass in both cases was very similar: 79.38% and 80. 66% of PHA for sodium propionate and peanut oil, respectively. Both carbon sources have a similar effect on the final composition of the total biomass, being the only difference in the growth kinetics observed in both cases. Furthermore, it suggests that peanut oil might be a carbon source with a composition more useful than sodium propionate for microbial use.
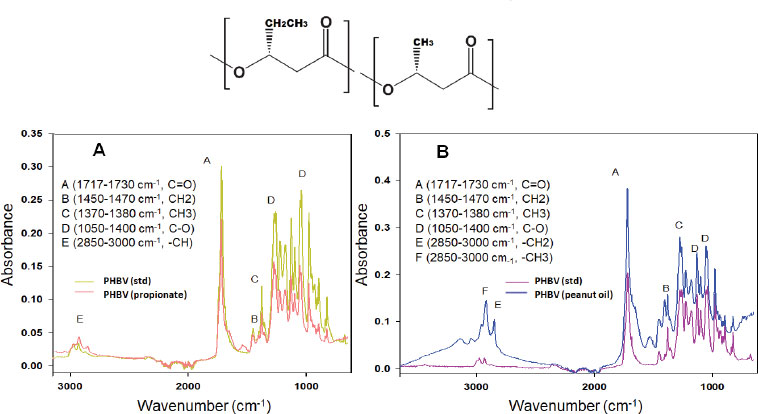
The PHA produced by C. necator in the presence of sodium propionate showed a composition of 94.16 ± 2.29% mol of PHB and 5.83 ± 0.10% mol of PHV, whereas the PHA produced by using peanut oil showed a composition of 99.95 ± 5.94% mol of PHB and 0.04 ± 0.01% mol of PHV, and traces of hydroxyhexanoic monomers. According to literature, the usage of sodium propionate induces the formation of PHBV, which can improve the thermal and physical properties of the biopolymer produced [20].
The spectra of Fig. (3) showed representative bands of the PHAs synthetized for C. necator. Where at 1720 cm-1, the presence of the carbonyl group of the ester was observed, at 1453 cm-1 the union of a CH2 with antisymmetric movement. In the region at 400 to 1500 cm-1, the presence of the PHA fingerprint was observed [2]. On the other hand, at 1278 cm-1 was observed a carbonyl group (C=O), confirms the ester bond, and at 2929 cm-1, the stretching group CH is attributed, which indicates the presence of HV in the PHA [21] (Fig. 2a). In addition to being compared with the commercial standard PHBV and the report in the literature of obtaining PHBV with sodium propionate [21]. Whereas, for PHA derived from peanut oil as substrate, we observed the fingerprint at 400 to 1500 cm-1, and at 1725 cm-1 is the stretching of the ester carbonyl group. Different peaks were observed in a wave number between 3049 to 3141 cm-1, these bands could be caused by water molecules.
3.2. Two-stage PHA Production Followed by Micro Respirometry
During the micro respirometric characterization of the two-stage PHA production process, a total of 216 experiments in the microreactor system were performed with samples taken from the mini reactors at different times of the culture: hours 21, 33, 36, 42, and 48. Fig. (4) illustrates an example of a respirometric experiment performed on a sample obtained at hour 33 when the concentration of fructose in the culture medium was approximately 2 g L-1. After eliminating the fructose present in the sample (as described in the Material and Methods section), a micro respirometric experiment was performed, and Fig. (4) shows the results obtained. It was observed that the rO2 increased when a pulse of a given concentration of fructose (SP) was added, the rO2 quickly reached a maximum value (r´O2), and then it slowly decreased to zero as the fructose was depleted in the microreactor. The same behavior was observed at different concentrations of SP and even in the presence of sodium propionate or peanut oil. It was also observed that the higher the concentration of SP, the higher the rO2 maximum value reached. By plotting the r´O2 values with the corresponding SP values injected into the microreactor, a Monod-like behavior was observed (Fig. 4B). By linearizing the data in Fig. (4B) using the Hanes-Woolf equation, the values of KS and rO2 max for each type of carbon source were easily retrieved (Fig. 4C). The average correlation coefficient (R2) between experimental data and the Monod model was 0.9805 ± 0.0101 for all 216 micro respirometric experiments. The validity of the respirometric technique to characterize a microbial culture kinetically and stoichiometrically has been demonstrated on several occasions and with different types of culture by our research group [13, 16, 22].
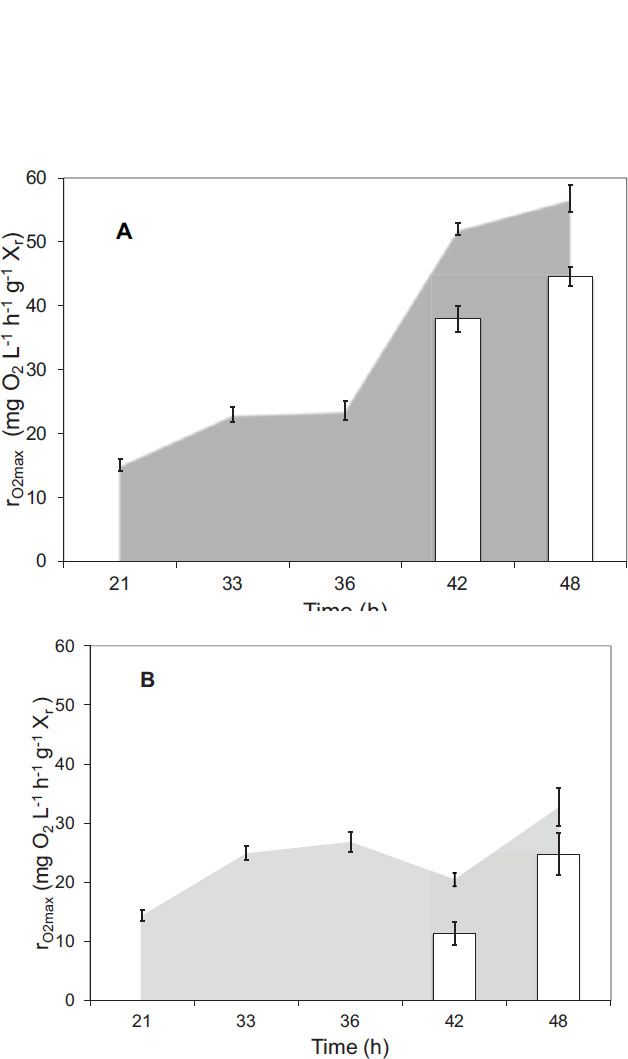
Fig. (5) illustrates the specific values of rO2max obtained in the microreactors. The micro respirometric characteri- zation of the samples obtained at hours 21, 33 and 36 were done using fructose as substrate. A significant increase was observed between hours 21 and 33, corresponding to the increase in biomass activity. During hours 33 and 36, the average rO2max values were 23.02 ± 1.15 mg O2 L-1 h-1 g-1 and 23.66 ± 1.52 mg O2 L-1 h-1 g-1 X, respectively. These values were not significantly different and corresponded to the first stage of PHA production when there was still fructose in the liquid media. Globally, there is a lack of literature reports about respirometry applied for the characterization of cultures of C. necator; hence, this is the first time that this technique has been applied to a culture of this type, and there is no data available to make an adequate comparison of the values.
The samples taken from the mini reactors during the second stage of PHA production (samples corresponding to hours 42 and 48) were characterized in the presence of the three-carbon sources (Fig. 5). In the case of the experiments with pulses of fructose (Fig. 5, gray area), the specific values of rO2max obtained in the culture supple- mented with peanut oil (52.05 ± 0.97 mg O2 L-1 h-1 g-1 at hour 42 and 56.84 ± 2.13 mg O2 L-1 h-1 g-1 at hour 48) were significantly higher than those obtained in the culture growing with sodium propionate (20.45 ± 1.12 mg O2 L-1 h-1 g-1 at hour 42 and 32.69 ± 3.19 mg O2 L-1 h-1 g-1 at hour 48). Although there was a significant increase in the respiration rate of both cultures compared with stage 1, the culture supplemented with sodium propionate showed less kinetic activity than the culture growing in the presence of peanut oil. Also, a recovery tendency in the specific values of r´O2max of the culture with sodium propionate was observed. On the other hand, when the respirometric experiments were done using the carbon source in which currently the culture was growing, the respiration rates were slightly lower compared with the experiments in the presence of fructose (Fig. 5 white columns). In the case of sodium propionate, a decrease in activity like that in the presence of fructose was also observed, followed by a recovery. This may signify that when the culture that was previously growing on fructose as the sole carbon source was suddenly changed to sodium propionate as a carbon source, there was a delay in the microbial capability to adapt to this new carbon source provoked by a transitory inhibition caused by the propionic acid formation [8]. This was not the case for the culture growing on peanut oil as the new carbon source.
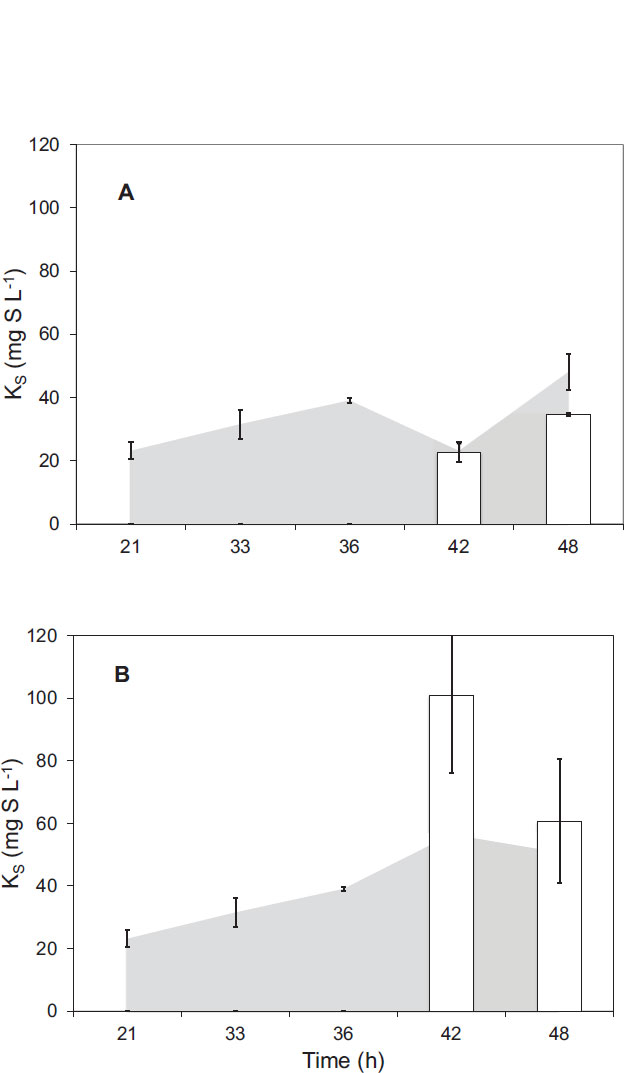
In regard to the second kinetic parameter, KS, Fig. (6) shows the results obtained for its estimation during micro respirometric experiments. The results obtained with samples from the first stage of PHA production showed specific KS values of 31.55 ± 4.58 mg L-1 g-1 and 39.08 ± 0.70 mg L-1 g-1 for hours 33 and 36, respectively. This value was similar to the results obtained from a study [23], with a similar respirometry protocol applied to a culture of Pseudomonas putida F1 with glucose as the sole carbon source. The results obtained in samples supplemented with peanut oil corresponding to the second stage of the process showed a slight reduction in the KS values at hour 42 and then an increase in the value at hour 48. The case of the samples taken from the mini reactors during stage two and supplemented with sodium propionate showed an important increase in the obtained values of KS that indicates that the microorganism lost affinity for fructose during the carbon source change. The results obtained with the injection of pulses of sodium propionate and peanut oil showed that the microorganisms were more related to peanut oil than to sodium propionate. Specifically, the KS value for sodium propionate was 158% higher at hour 42 than the KS value for fructose. At the same time, the KS value for peanut oil was only 9% higher than the KS value for fructose at the same time. These results indicated that C. necactor had a similar affinity for fructose and for peanut oil and a low affinity for sodium propionate.
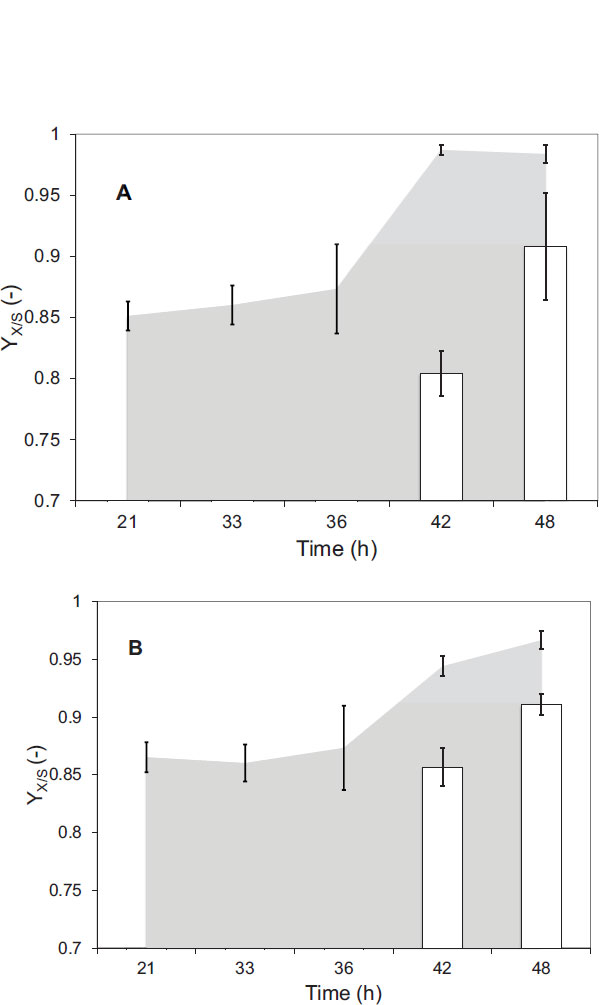
Finally, the results obtained for the parameter YX/S during the micro respirometric experiments indicated a high growth of C. necactor during the two-stage process (Fig. 7) since all the YX/S values were above 0.80. Specifically, the higher YX/S values were obtained with the experiments in the presence of fructose during the second stage that ranged between 0.80 - 0.98. The YX/S values obtained in the presence of peanut oil were lower (0.85 to 0.91) compared with those obtained in the presence of sodium propionate (0.94 to 0.97). The similar and high values obtained indicated a similar growth of C. necator on both new carbon sources that is correspondent by the similar biomass concentration reached in the minireactors at the end of the culture. However, it is important to note that the YX/S values obtained are significantly superior to those reported by a researcher [24], who worked with Ralstonia eutropha (ATCC 17697) and obtained a YX/S value of 0.4242 g g-1 when working with 5 g L-1 of fructose while tripling this amount, they obtained 0.2507 g g-1, attributing it to a minimum consumption of fructose by the microorganism, due to the early termination of fermentation. In the case of Wautersia eutropha (formerly Ralstonia eutropha), when fed with 10 g / L of fructose, the g g-1 value was 0.32 g g-1 [2].
CONCLUSION
Microrespirometry technique was used for the first time to successfully follow the kinetic and stoichiometric behavior during a sudden change of the carbon source under a two-stage process design. Although sodium propionate has been proposed in several studies as a suitable carbon source for PHA production, the results showed that it has an important inhibition effect on Cupriavidus necator compared with the utilization of peanut oil, in which a reduction in the respiration rate and an increase in the value of the substrate affinity constant were observed. This negative effect of propionate continued even in the presence of the original carbon source, fructose, leading to a reduction in biomass and PHA yields. The kinetic and stoichiometric parameters obtained with the micro respirometric technique are of importance for scaling-up purposes. Furthermore, the combined use of traditional analytical techniques with substrate pulse micro respirometry could be advantageous for a deep characterization of a given PHA production process. Finally, it is worth noting that the use of respirometry during the assessment of low soluble substrate consumption needs further exploration, and it can become an important tool to evaluate the use of oil compounds for the growth of biomass.
AUTHORS' CONTRIBUTIONS
All authors contributed to the study's conception and design. Material preparation, data collection and analysis were performed by Irazú Pérez-Camacho, Norberto Chavarría-Hernández, Ma del Rocío López-Cuellar and Alberto Ordaz. The first draft of the manuscript was written by Alberto Ordaz and Claudia Guerrero-Barajas, and all authors commented on previous versions of the manuscript. All authors read and approved the final manuscript. The authors declare that they have no conflict of interest.
LIST OF SYMBOLS
| Cb | = Endogenous Respiration of the Microorganism (mg L-1) |
| COD | = Chemical Oxygen Demand (mg L-1) |
| DO | = Dissolved oxygen (mg L-1) |
| KLa | = Volumetric oxygen transfer coefficient (h-1) |
| KS | = Substrate affinity constant mg L-1 |
| PHA | = Poly (3-hydroxyalkanoates) |
| r´O2max | = Observed maximum oxygen uptake rate |
| rO2 | = Biological oxygen uptake rate (mg O2 L-1 h-1) |
| rO2max | = Maximum oxygen uptake (mg O2 L-1 h-1) |
| S | = Substrate (g L-1) |
| SP | = Substrate pulse concentration (mg L-1) |
| YO2/S | = Substrate oxidation yield (-) |
| YX/S | = Growth yield (-) |
| X | = Biomass (g L-1) |
| Xr | = Residual biomass after extraction (g L-1) |
ETHICS APPROVAL AND CONSENT TO PARTICIPATE
Not applicable.
HUMAN AND ANIMAL RIGHTS
Not applicable.
CONSENT FOR PUBLICATION
Not applicable.
AVAILABILITY OF DATA AND MATERIALS
The data supporting the findings of the article is available in Zenodo at https://zenodo.org/records/ 10806303, reference number: 10806303.
FUNDING
This study was funded by Consejo Mexiquense de Ciencia y Tecnología (COMECYT), Funder ID: Master scholarship, (Grant number: 17BEPM0087-11).
CONFLICT OF INTEREST
The authors declare no conflict of interest, financial or otherwise.
ACKNOWLEDGEMENTS
We gratefully acknowledge the COMECYT graduate scholarship granted to Irazú Pérez-Camacho. The authors also thank Dr. Frederic Thalasso Siret from the Centro de Investigación y Estudios Avanzados, IPN (CINVESTAV) for his technical support.