All published articles of this journal are available on ScienceDirect.

Removal of Heavy Metals from Foundry Wastewater using Magnetic Graphene Oxide
Authors Info & Affiliations
Abstract
Introduction
This research paper explores the potential of heavy metals removal from foundry effluents using graphene oxide (GO) and magnetic graphene oxide (MGO) as adsorbents.
Methods
The preparation of graphene oxide (GO) was performed by the modified Hummers method, while that of magnetic graphene oxide (MGO) was done through coprecipitation methods, with analysis confirming its usefulness in removing metal ions. The influence of contact time, adsorbent dosage, and temperature on the heavy metal removal efficiency was subsequently investigated. The GO and MGO were further characterized using Fourier Transform infrared (FTIR) spectroscopy, scanning electron microscopy (SEM), and Brunauer-Emmett-Teller (BET) analyses.
Results
The observed results pointed to GO demonstrating comparatively better removal efficiencies than MGO for Cr, Fe, Pb, Cd, and Zn: 95.40%, 94.00%, 95.80%, 94.2%, and 95.7%, respectively, compared to 88.70%, 87.4%, 90.2%, 90.7%, and 91.2%. Successful synthesis of graphene oxide (GO) and magnetic graphene oxide (MGO) was confirmed by using characterization techniques such as SEM, BET, and FTIR. The morphology and high surface area of GO with a flake-like structure were observed, whereas successful modification of iron nanoparticles onto MGO was observed with a high specific surface area of 1165.220 m2/g and an abundance of surface functional groups.
Discussion
The heavy metals, which originate from foundry wastes, are removed from the wastewater by using the method of magnetic graphene oxide in this study. Various characterization methods, including SEM, BET, and FTIR, are studied. The parameters affecting the removal of heavy metals are the contact time, adsorbent dosage, and temperature. Contact time increases the opportunity to interact between the adsorbent and metal ions with a longer duration, whereas the number of active sites available to adsorb the heavy metal increases since the adsorbent dosage is higher, thereby increasing the efficiency of removal.
Conclusion
The adsorption could be described in the manner of the Langmuir isotherm and pseudo-second-order kinetics, which depicts MGO's successful removal of heavy metals from foundry wastewater.
1. INTRODUCTION
“Water is, by definition, the most important resource on the planet for human and even animal survival. Water scarcity has become one of the major hindrances to economic development along with the increased intensity of industrialization and urbanization” [1]. Today, it is becoming increasingly more difficult to ensure adequate and reliable sources of water owing to rapid population growth and the degradation of natural ecosystems. At the same time, there has been an increasing spread of water contamination within the water cycle. Human activities include mining, agriculture, and industrial processes, as well as the use of compounds containing toxic metals for use in homes and agriculture. All of these are the main causes of water contamination [2]. Increase in chemical pesticides, fertilizers, effluents, and untreated wastewater from irrigation contaminates surface and groundwater. Improper disposal of industrial effluents has been blamed for the contamination of water bodies, lowering levels of dissolved oxygen, and increasing biological oxygen demand (BOD) [3].
For instance, in Nigeria, less than 10% of industries are reported to treat their effluents before discharging them into surface waters [4], and this wastewater contains significant levels of heavy metals and organic pollutants, also including suspended particles, dyes, chemical oxygen demand, coloured pigments, and BOD. Heavy metals are the primary contaminant in wastewater and have emerged as a significant environmental concern on a global scale, leading to serious health issues such as cancer, kidney malfunction, lung damage, and central nervous system (CNS) damage [5, 6]. Mining [7], electroplating [8, 9], metallurgy [10], chemical industries [11], foundry [12], and residential wastewater [13] are the main streams of heavy metal releases into water. Foundries generate a significant amount of waste, ranging from 0.25 to 2 tons of solid waste for every ton of casting produced [14]. These wastes are created from used materials, dust from sand and metals, reaction by-products, as well as organic and inorganic compounds, among others [15]. Foundry wastewater contains heavy metals such as lead, zinc, chromium, copper, nickel, and iron, which can result from metal casting and machining processes [15]. It also includes the oil and grease used for the lubrication of the machines, particulates and dust from the moulding operation, and chemical additives from the binders, coolants, and other agents employed in production [12]. These heavy metals are not decomposable; thus, their existence in lakes and streams causes bioaccumulation in living creatures, resulting in health issues in humans, plants, and animals [16]. Therefore, getting rid of these harmful contaminants in wastewater is critical before discharging them into the environment for environmental and public protection.
Several methods have been employed in industry to effectively remove dyes and toxic metals from water and wastewater. These techniques include ion exchange [17], ultrafiltration [18], adsorption [3, 19-21], electrodialysis [22, 23], reverse osmosis [24], flocculation [25], nanotechnology [26-28], and coagulation [29]. The type and concentration of heavy metals, financial considerations, the impact on the environment, and the required level of purity of the treated wastewater all have an impact on the removal process selection. The most often used technique is adsorption because of its low cost, excellent thermal stability, large surface area, and high efficiency [30]. To remove heavy metals, several adsorbents are employed, which include functionalized polymers [31, 32], carbon nanotubes [33], metal-organic frameworks [34], natural inorganic minerals, agricultural waste-based adsorbents [30, 35, 36], and activated carbon. Nevertheless, with all their promised potential, existing adsorbents have some drawbacks that they could not overcome, including challenges in rejuvenating and recovering adsorbents after their use in wastewater treatment for reuse and sustainability purposes.
Graphene and graphene oxide (GO) have gained widespread interest, owing to their outstanding properties, which position them as highly versatile and promising materials for a broad range of applications [37]. According to Refs [37, 38], these properties include a high surface area of contact, high capacity for adsorption, an abundance of oxygen-containing functional groups [39], magnetic properties [40], good re-usability after regeneration [2], and selectivity in treating water [41]. Owing to its hydrophilic properties, graphene oxide undergoes modifications to enhance its properties, and for easy recovery from wastewater which allows it to be easily recovered from wastewater. Several magnetic nanoparticles (NPs) have been used to modify GO, including iron NPs synthesized from bio-waste biomass [42], Ni-ferrite NPs embedded in polyvinyl alcohol [39], silica NPs [43], and polyethersulfone (PES) NPs [44], among others. In ref [45], The authors removed Pb2+ ions using graphene oxide nanosheets synthesized with the modified Hummers method. Though it had an optimum removal efficiency of 842 mg/g, graphene oxide incurred irreversible aggregation in an aqueous solution. Also, using the co-precipitation method, synthesized magnetic graphene oxide was applied to remove lead, chromium, copper, zinc, and nickel ions from drinking water [46]. To optimize the adsorption process, characterize the materials’ properties, and assess their potential for real-world use in wastewater treatment, this study focuses on the use of graphene oxide and magnetic graphene oxide for the adsorption of heavy metals present in foundry wastewater.
2. MATERIALS AND METHODS
2.1. Chemicals and Reagents
Graphite flakes (natural −300 mesh, ACS Materials (AzoNetwork), sodium nitrate (Titan Media), sulphuric acid (98%, Honeywell Fluka), potassium permanganate (AnalaR), hydrogen peroxide (30%), hydrochloric acid (5%, Loba Chemie Pvt), ferric chloride (Guangdong Guanghua Sci-Tech), and ferrous sulphate (Molychem) were used. Deionized water was used throughout the experiment.
2.2. Synthesizing Graphene Oxide (GO)
The modified Hummers method was used for the synthesis of graphene oxide. In total, 5 g of graphite flakes were reacted with 2.5 g of sodium in a volumetric flask placed in an ice bath. Then, 115 mL of sulphuric acid was added to the mixture and stirred for 15 min with the help of a magnetic stirrer on a hot plate. For 45 min, 15 g of potassium permanganate was added slowly to the solution, ensuring the temperature was kept below 10ºC. The solution was raised back to 35ºC after being removed from the ice bath. The mixture was stirred overnight so that proper exfoliation of the graphite was achieved. Gradually, 250 mL of deionized water was added, which, due to the exothermic reaction, resulted in an increase in the temperature. The temperature of the solution was increased to 95ºC when the solution had acquired a brownish color. The solution was stirred for 30 min at this temperature before adding another 250 mL of deionized water to dilute it further. Finally, 10 mL of 30% v/v hydrogen peroxide was added to the solution to stop the reaction. After the solution was cooled to room temperature, the mixture underwent filtration and was subsequently washed three times with 5% hydrochloric acid. An additional rinsing was carried out with deionized water until the pH level was neutral and the material had a gel-like consistency [38, 39].
2.3. Synthesis of Magnetic Graphene Oxide
Magnetic graphene oxide (MGO) was synthesized by the co-precipitation process. By dispersing 0.15g of graphene oxide (GO) in 150 mL of deionized water and then sonicating the mixture for two hours, a clear suspension of GO was created. In one hundred milliliters of purified water, FeCl3∙7H2O and FeSO4∙6H2O were mixed with a 2:1 mole ratio, respectively. After rapidly agitating the (GO) suspension for 45 min at room temperature, FeCl3 and FeSO4 solutions were gradually added. To reach a pH of 10, 30% ammonia solution was added dropwise, producing a black suspension. The resulting black suspension was stirred at 85°C for 20 min before cooling to room temperature. The product was then washed with deionized water heated to 70°C to obtain magnetic graphene oxide (MGO), specifically the GO/Fe3O4 composite [40, 42].
2.4. Characterization Techniques
FTIR spectroscopy (Nicolet iS10 FT-IR), scanning electron microscopy, and BET analysis (TRISTAR II 3020 Kr) were used in the characterization of GO and MGO.
2.5. Batch Adsorption Experiments
Batch adsorption experiments were carried out with a hot plate stirrer at a speed of 180 rpm. In these experiments, 500 mL Pyrex beakers containing 50 mL of wastewater were utilized. A total of 0.03 g of graphene oxide (GO) adsorbent was added to the wastewater. The mixture was stirred continuously at 180 rpm at a constant temperature of 25°C for 24 h. Following this, samples were collected at intervals of 10, 30, and 60 min to study the effect of contact time at room temperature (25°C). Different adsorbent doses were applied (0.02 g, 0.03 g, 0.05 g) to observe their effect on heavy metal removal. The different doses were added to 50 mL of real wastewater. The effect of temperature was studied at 25°C, 50°C, and 60°C, with 0.03 g of GO being added to 50 mL of real wastewater. The same experimental conditions were followed for MGO. Each parameter was studied to observe its influence on the adsorption efficiency of both GO and MGO. GO was filtered from the effluent using a Whatman filter paper of 150 mm diameter. Before and after the adsorption process, the concentration of heavy metals in the effluent was analyzed using the Perkin Elmer atomic absorption spectrophotometer (Analyzer 400 AA).
3. RESULTS AND DISCUSSION
The concentration of heavy metals was evaluated through analysis in both treated and untreated wastewater; their results are presented in Tables 1 and 2, respectively.
| Metals | Cr | Fe | Pb | Cd | Zn |
|---|---|---|---|---|---|
| Concentration (mg/L) | 2.094 | 1.672 | 0.072 | 0.052 | 0.256 |
| Parameter | Sample | Cr | Fe | Pb | Cd | Zn |
|---|---|---|---|---|---|---|
| GO | ||||||
| Time (mins) | 10 | 0.859 | 0.842 | 0.012 | 0.012 | 0.048 |
| 30 | 0.336 | 0.493 | 0.009 | 0.009 | 0.029 | |
| 60 | 0.137 | 0.141 | 0.005 | 0.004 | 0.015 | |
| 1440 | 0.116 | 0.101 | 0.003 | 0.002 | 0.011 | |
| Temperature (°C) | 25 | 0.365 | 0.405 | 0.012 | 0.010 | 0.122 |
| 50 | 0.211 | 0.212 | 0.006 | 0.006 | 0.071 | |
| 60 | 0.151 | 0.139 | 0.004 | 0.003 | 0.018 | |
| Adsorbent Dosage (g) | 0.02 | 0.794 | 0.521 | 0.014 | 0.018 | 0.122 |
| 0.03 | 0.249 | 0.217 | 0.008 | 0.009 | 0.071 | |
| 0.05 | 0.096 | 0.105 | 0.005 | 0.003 | 0.018 | |
| MGO | ||||||
| Time (mins) | 10 | 0.925 | 0.943 | 0.015 | 0.018 | 0.148 |
| 30 | 0.492 | 0.605 | 0.014 | 0.014 | 0.140 | |
| 60 | 0.369 | 0.329 | 0.012 | 0.011 | 0.136 | |
| 1440 | 0.237 | 0.226 | 0.010 | 0.009 | 0.133 | |
| Temperature (°C) | 25 | 0.492 | 0.605 | 0.015 | 0.014 | 0.140 |
| 50 | 0.346 | 0.408 | 0.010 | 0.007 | 0.084 | |
| 60 | 0.237 | 0.211 | 0.007 | 0.005 | 0.023 | |
| Adsorbent Dosage (g) | 0.1 | 1.020 | 0.741 | 0.025 | 0.031 | 0.143 |
| 0.2 | 0.578 | 0.617 | 0.013 | 0.016 | 0.101 | |
| 0.3 | 0.245 | 0.403 | 0.009 | 0.009 | 0.051 | |
3.1. Wastewater Characterization
Table 1 provides the characterization of wastewater and shows the concentration of heavy metals in untreated foundry wastewater, while Table 2 provides the concentration of heavy metals in foundry wastewater treated with GO and MGO.
3.2. Characterization of Adsorbent
3.2.1. FTIR Spectra of GO and MGO
The FTIR analysis was performed to identify the functional groups present in GO and MGO. The FTIR spectra for GO, which are illustrated in the figure (Fig. 1) and summarized in the table (Table 3), show a strong absorption peak at 3480 cm-1 due to O-H bending vibrations. This absorption peak at 1635 cm-1 can be labelled for the C=C stretches of the aromatic groups, whereas the peak at 1007 cm-1 is assigned to C-O stretches due to the alkoxy groups. The FTIR results corroborated previous research [1], indicating that GO nanosheets carried various oxygen-containing groups. These oxygen groups on the surface of GO serve as binding sites for metal ions in the adsorption process, confirming the formation of graphene oxide (GO). The FTIR spectra for MGO are shown in Table 3 and Fig. (2). The GO peaks persisted in the MGO spectra but with significantly reduced intensities following the chemical deposition of iron ions onto the GO sheets. In the MGO spectra, the O-H stretching vibrations appeared less intense and were first observed at 3445 cm-1. The peaks at 1877 cm-1 were associated with C=O stretching of carboxyl groups, and the peak at 1056 cm-1 was linked to C-O stretching vibrations of the epoxy group. A distinct and sharp peak at 685 cm-1 in the MGO spectrum, corresponding to Fe-O stretching vibrations, confirmed the presence of iron particles on the GO surface, corroborating findings from a previous study [1, 37].
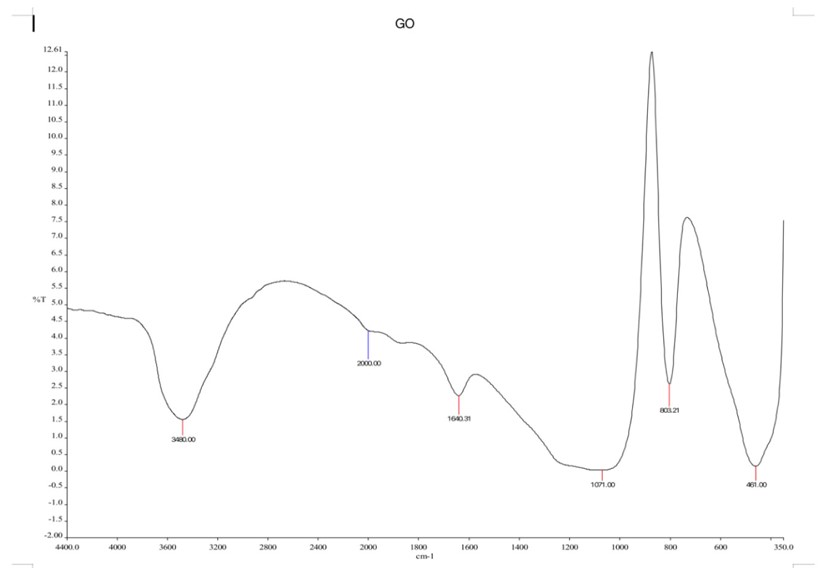
FTIR spectrum for graphene oxide.
| Graphene Oxide | Magnetic Graphene Oxide | ||
|---|---|---|---|
| IR Peak | Bond type | IR Peak | Bond type |
| 461.00 | Fe-O | 685.36 | Fe-O stretching |
| 1071.00 | C-O stretching | 1056.00 | C-O |
| 1640.31 | C=C stretching | 1631.72 | C=C stretching |
| 3480.00 | O-H bending vibrations | 1877 | C=O stretching |
| - | 3445.00 | O-H | |
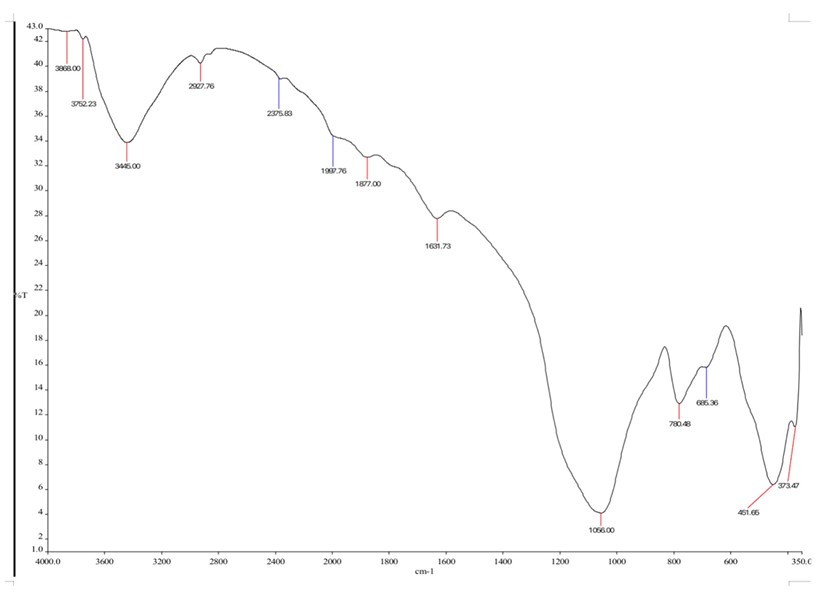
FTIR spectrum for magnetic graphene oxide.
3.2.2. SEM Analysis of GO and MGO
The surface topography of GO nanosheets and MGO was investigated using SEM imaging. Plate (P1A) shows the SEM micrograph of GO. Graphene oxide (GO) shows flake-like, layered morphology with a folded, undulating, and crumpled surface texture. The GO sheets have a large surface area while being extremely thin. The crumpled structures observed on the edges of the exfoliated sheets of graphene oxide were an indication of successful exfoliation from graphite, derived from the oxidation process. Plate (P1B) depicts the MGO SEM micrograph. There is a visual indication of the iron nanoparticles as lighter dots, indicating their presence. The surface of the graphene oxide behaves as a framework for the attached iron nanoparticles. The iron nanoparticles are not evenly distributed but form clusters that heterogeneously deposit on the graphene oxide. This analysis shows that the synthesis of graphene oxide and magnetic graphene oxide is a success. It correlates with previous studies reported [47, 48].
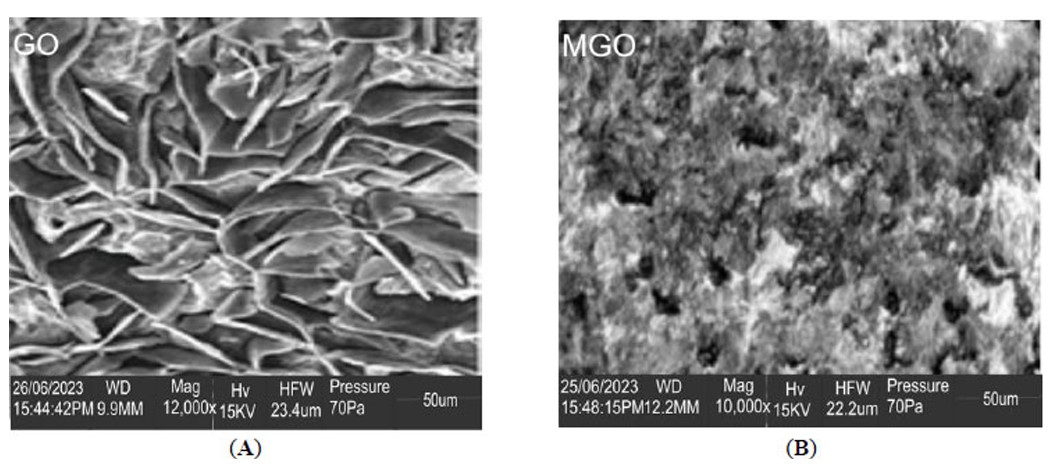
SEM characterization of (A) graphene oxide (GO) and (B) magnetic graphene oxide (MGO).
3.2.3. BET Analysis of GO and MGO
The textural characteristics of the synthesized GO and MGO were evaluated using nitrogen adsorption-desorption measurements through the BET method. Table 4 presents the pore sizes, specific surface areas, and pore diameters of GO and MGO. The adsorbents exhibited remarkably high specific surface areas according to BET measurements. GO and MGO have BET surface areas of 1260.35 m2/g and 1165.22 m2/g. With pore sizes of 0.452 and a pore diameter of 2.825 nm, GO and MGO showed mesoporous properties that agree with published research [47]. Figures 3 and 4 show the nitrogen adsorption-desorption isotherm for GO and MGO.
| Sample | BET Surface Area (m2/g) | Adsorption Average Pore Size (cm3/g) | Adsorption Pore Diameter (nm) |
|---|---|---|---|
| GO | 1260.350 | 0.452 | 2.825 |
| MGO | 1165.220 | - | 2.825 |
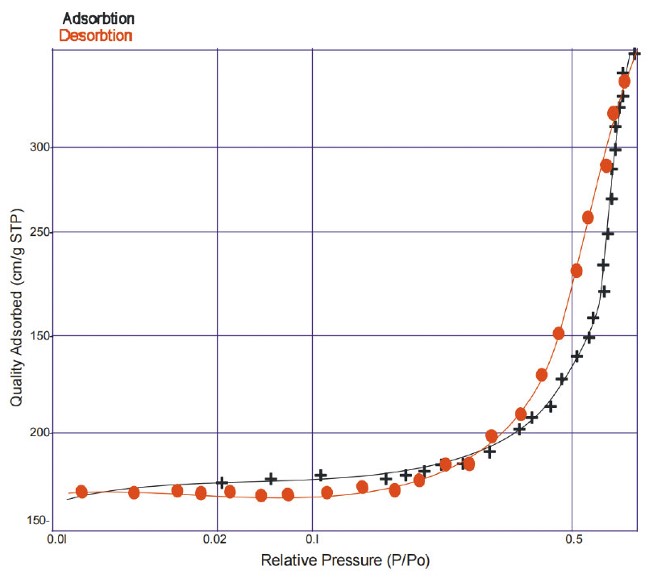
N2 adsorption–desorption isotherm for GO.
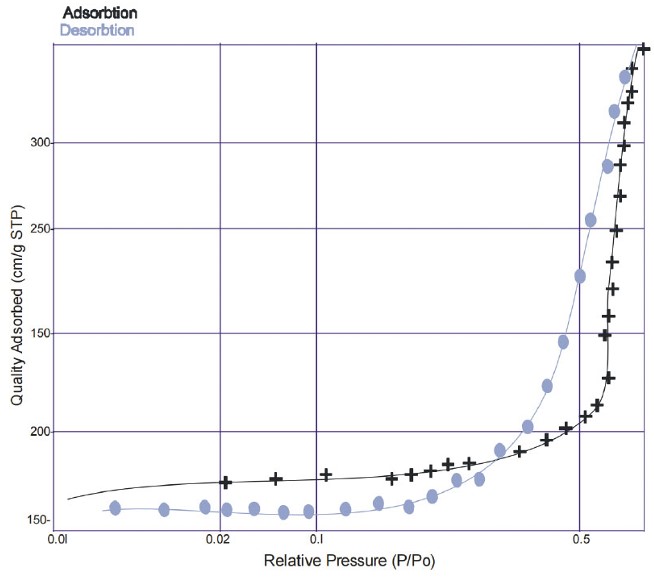
N2 adsorption–desorption isotherm for MGO.
3.3. Adsorption Studies
Chromium, iron, lead, cadmium, and zinc adsorption was done in a batch process using GO and MGO while varying the contact time, temperature, and adsorbent dosage to evaluate adsorption efficiencies. Based on the results obtained, the adsorption process was observed to greatly favour the removal of the heavy metal ions.
3.3.1. Effect of Contact Time on Removal Efficiency
The influence of contact time was evaluated by varying the contact time intervals at 10, 30, 60, and 90 minutes while maintaining constant temperature and adsorbent dosage. The effect of contact time on the heavy metal ion adsorption performance for GO and MGO is shown in (Figs. 5 and 6). The adsorption increased with an increase in contact time, which is due to a longer interaction between the metal ions.
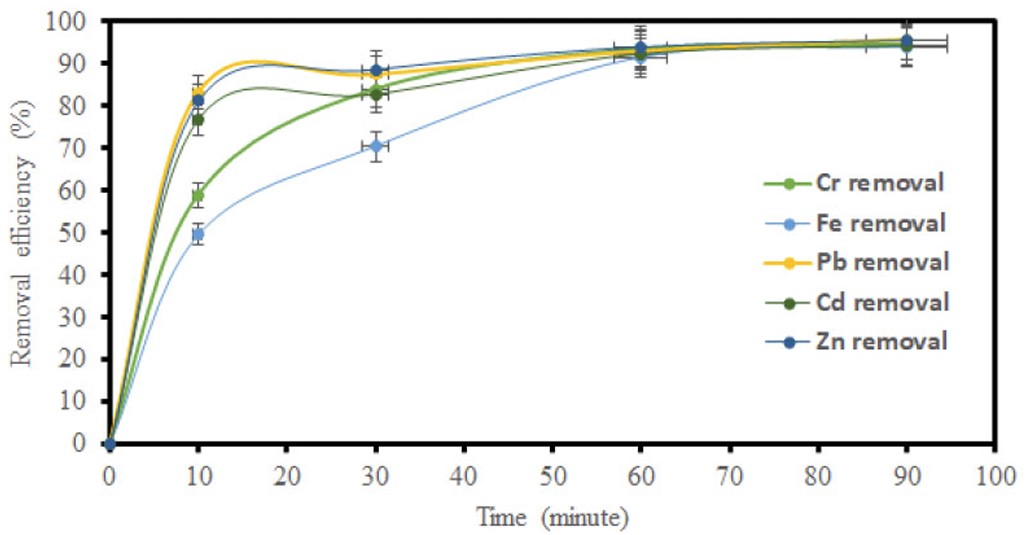
Impact of time on removal efficiency using GO.
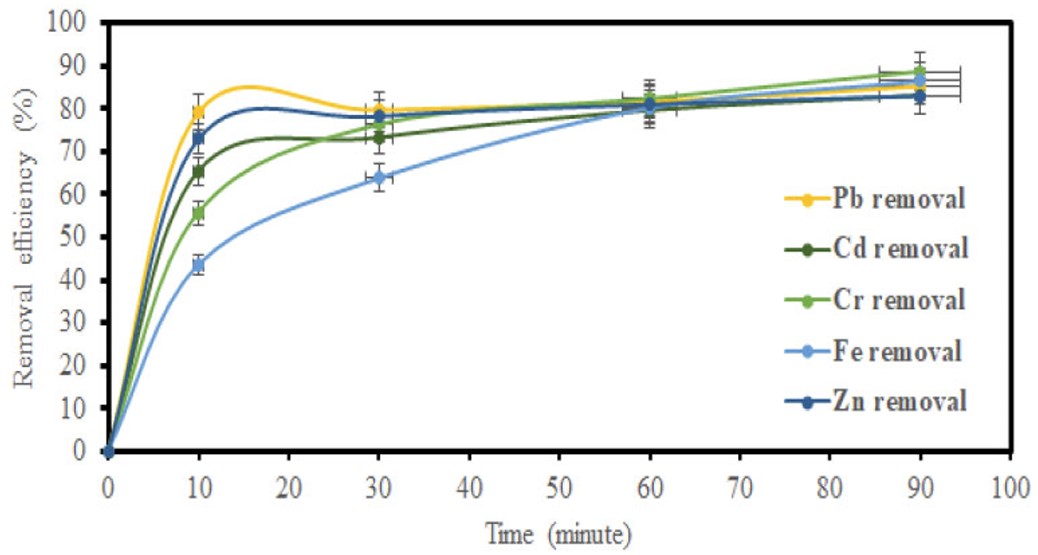
Impact of time on removal efficiency using MGO.
3.3.2. Effect of Temperature on Removal Efficiency
The influence of temperature on the adsorption process was evaluated, and the temperature was varied (25, 50, and 60°C) while keeping the contact time and adsorbent dosage constant. From the results in (Figs. 7 and 8), a direct correlation was observed between temperature and removal efficiency for GO and MGO. The temperature rise enhanced the adsorption efficiency, which may be attributed to the greater agitation of adsorbate molecules at higher temperatures, which promoted interaction between the adsorbate and adsorbent surface, hence improving the adsorption efficiency.
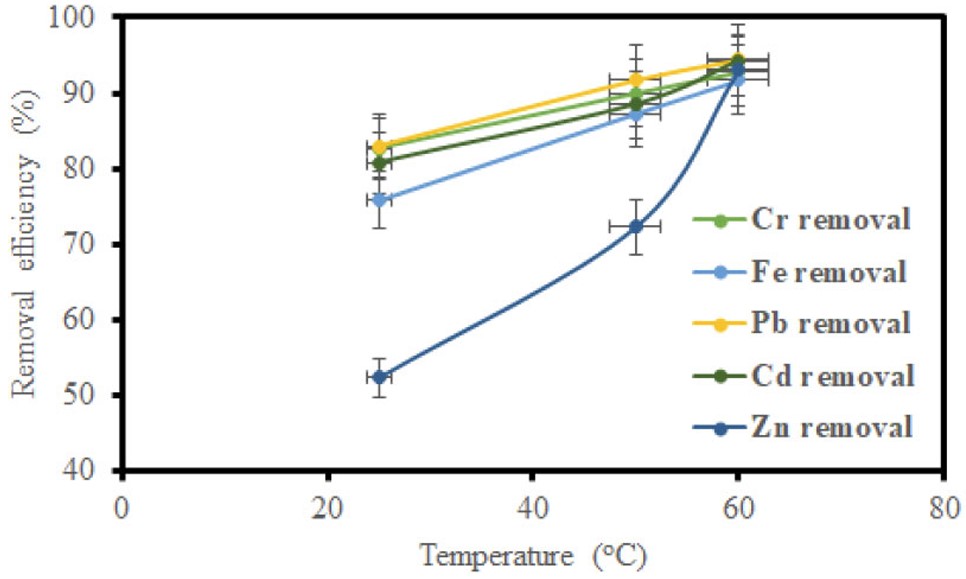
Impact of temperature on removal efficiency using GO.
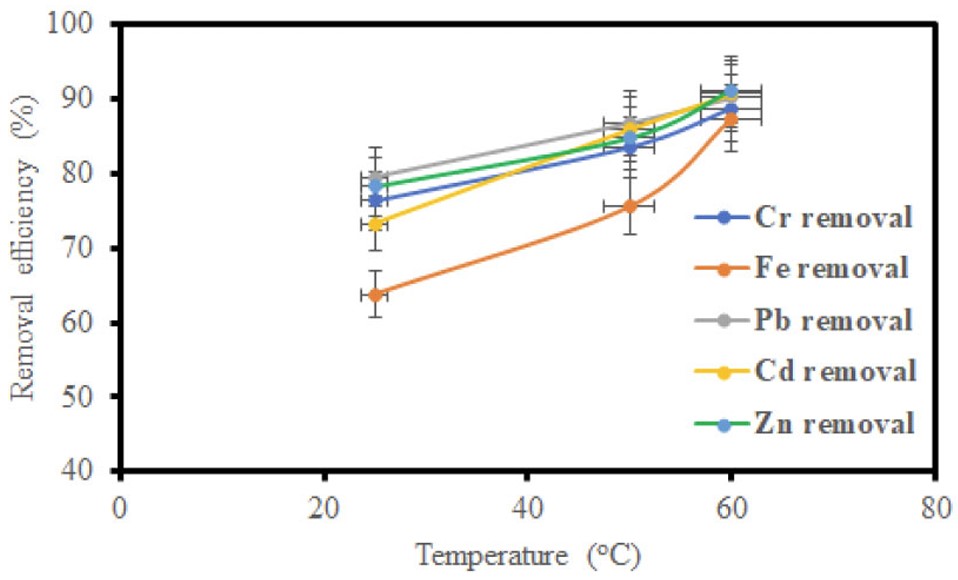
Impact of temperature on removal efficiency using MGO.
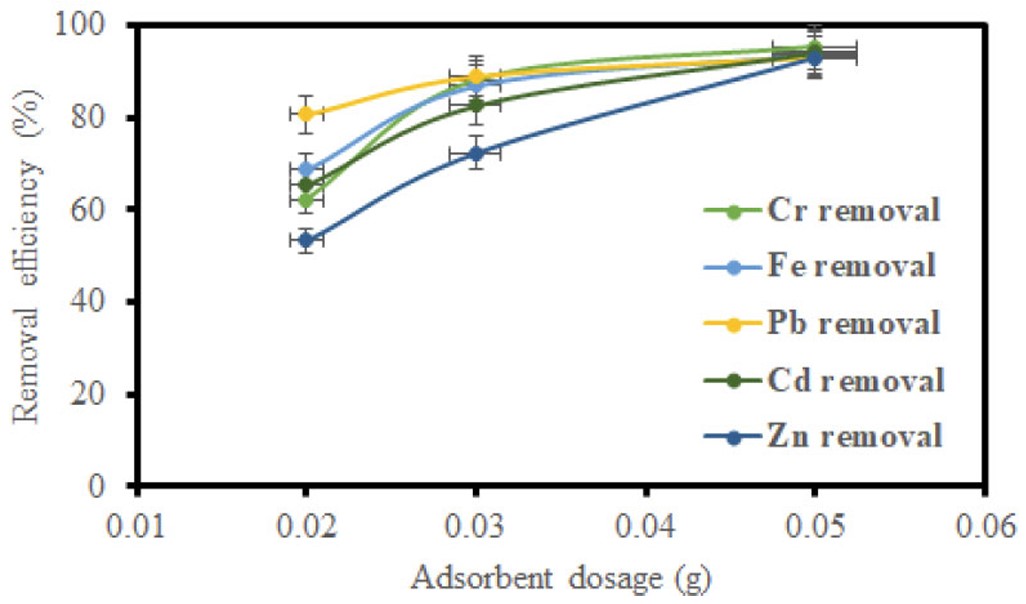
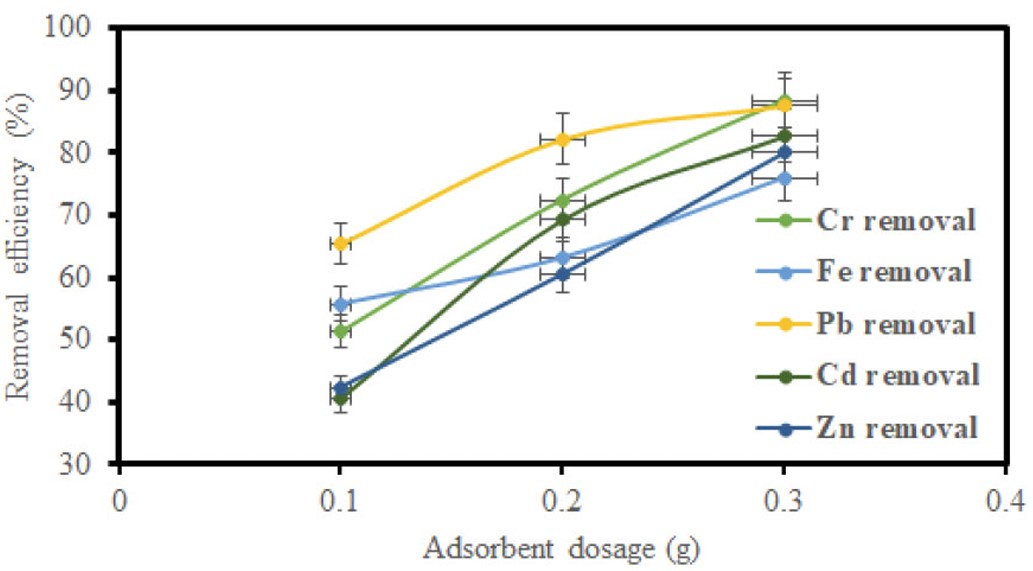
3.3.3. Effect of Adsorbent Dosage on Removal Efficiency
GO samples of 0.02 g, 0.03 g, and 0.05 g, and MGO samples of 0.1 g, 0.2 g, and 0.3 g were varied to assess their effect on the adsorption capability for heavy metal ions. The amount of adsorbent does, in fact, directly correlate with the contact area between adsorbate and adsorbent. The result of adsorbent dosage in the removal of metal ions with GO and MGO is demonstrated in (Figs. 9 and 10), respectively. The other sets of adsorption values increased with increasing dosage for both adsorbents. The mechanism could be due to a larger contact area and a high increase in adsorption sites. The experiment corroborates some previous studies [37].
Impact of adsorbent dosage on removal efficiency using GO.
Impact of adsorbent dosage on removal efficiency using MGO.
3.3.4. Comparison of the Removal Efficiency of Metal Ions on GO and MGO
Figures 5, 7, and 9 depict the removal efficiencies of heavy metals on graphene oxide adsorption. From the results, the maximum adsorption efficiencies obtained using GO for Cr, Fe, Pb, Cd, and Zn were 95.40%, 94.00%, 95.80%, 94.2%, and 95.7%, respectively. The removal efficiencies of MGO on the adsorption of heavy metals are depicted in (Figs. 6, 8, and 10). According to the results, the maximum adsorption efficiencies of Cr, Fe, Pb, Cd, and Zn obtained using MGO were 88.70%, 87.4%, 90.2%, 90.7%, and 91.2%, respectively. Therefore, the above results indicate that GO has more adsorption efficiency as compared to MGO. This is due to the Fe ions occupying the adsorption sites on GO.
3.4. Adsorption Isotherm Model Studies
The Freundlich and Langmuir isotherm models were adopted to study the adsorption isotherms. The regression coefficients of the model, as well as the Langmuir and Freundlich parameters, are detailed in Tables 5–8. High regression coefficients were found for both the Langmuir and the Freundlich models, showing a strong correlation between the models and the experimental data. On the other hand, the Freundlich regression coefficient was marginally greater. The equilibrium parameter (RL) for the Langmuir isotherm can be used to characterize the entire adsorption process. The adsorption process is considered favorable when the values of RL range between 0 and 1. Based on the values of RL presented in Table 7, the adsorption of Cr, Fe, Pb, Cd, and Zn by MGO is considered favorable according to the Langmuir isotherm. As shown in Table 6, the intensity (n) obtained is less than 1, which favors a homogenous process, not a heterogeneous process. The Freundlich constant, n, attained from the experiment is negative (−2.899, −2.138, −4.843, −2.955, and −0.818) for Cr, Pb, Fe, Cd, and Zn. Despite the strong regression coefficient, the negative values of n indicate that the adsorption data do not fit the Freundlich model. As a result, the surface of the adsorbent is non-heterogeneous with an exponential distribution of energy sites; thus, it does not promote the physical adsorption process [49, 50]. This is because the correlative sorption capacity factor, which is a function of the adsorption size and the heterogeneity of the system, is characterized by the Freundlich constant [51]. Additionally, if the n value is less than unity, it means that the adsorption process is chemical, which is a good chemical process [52]. The adsorption isotherm parameters suggest that a uniform adsorption mechanism may be predominant. In this case, the adsorption process involves the formation of metal ions, with the functional groups on the surface of MGO forming one-to-one inner surface complexes. This result is consistent with a prior study [1] that indicated that monolayer uptake was the main mechanism for the adsorption of metal ions employing a graphene oxide/iron-aluminum oxide composite, with similar results [2].
| Metal Ion | Maximum Adsorption Capacity qmax (mg/g) | RL | R2 |
|---|---|---|---|
| Cr | 1.41623 | 0.05 | 0.7491 |
| Fe | 0.901 | 0.071 | 0.7448 |
| Pb | 0.062 | 0.028 | 0.9827 |
| Cd | 0.0359 | 0.056 | 0.9309 |
| Zn | 0.0647 | 0.232 | 0.9956 |
| Metal Ion | Maximum Adsorption Capacity qmax (mg/g) | RL | R2 |
|---|---|---|---|
| Cr | 1.6184 | 0.021 | 0.7215 |
| Fe | 1.126 | 0.028 | 0.7247 |
| Pb | 0.0738 | 0.08 | 0.8751 |
| Cd | 0.0485 | 0.128 | 0.904 |
| Zn | 0.256 | 0.285 | 0.8445 |
| Metal Ion | n | R2 |
|---|---|---|
| Cr | −2.899 | 0.9348 |
| Fe | −2.138 | 0.9277 |
| Pb | −4.843 | 0.9956 |
| Cd | −2.955 | 0.9924 |
| Zn | −0.818 | 0.9989 |
| Metal Ion | n | R2 |
|---|---|---|
| Cr | −4.3630 | 0.9195 |
| Fe | −3.5524 | 0.9129 |
| Pb | −10.0604 | 0.9627 |
| Cd | −6.9589 | 0.9745 |
| Zn | −9.1241 | 0.9576 |
The Langmuir adsorption isotherms are presented in Eqs. (1-3)
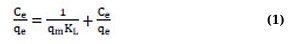
where,
Ce represents the equilibrium concentration;
qm represents the highest adsorption capacity;
qe indicates the adsorption capacity at equilibrium;
KL represents the Langmuir constant.
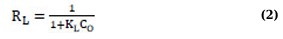
where
KL represents the Langmuir constant (mg/g);
CO represents the initial adsorbate concentration (mg/g);
RL indicates the adsorption nature.
The Freundlich adsorption isotherm is as follows:
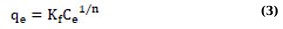
where
qe represents the equilibrium adsorption capacity;
Ce is a representation of the equilibrium concentration;
Kf represents the Freundlich equilibrium constant;
n represents the Freundlich constant.
3.5. Adsorption Kinetics Studies
Both pseudo-first-order and pseudo-second-order models were used to examine the kinetics of metal ion adsorption onto GO and MGO (Table 9). Both models’ regression coefficients were noticeably high (>0.9), indicating that the adsorption process fits both kinetic frameworks nicely. For both GO and MGO, the pseudo-second-order kinetic model showed relatively greater regression coefficients compared to those of the pseudo-first-order model. This suggests that pseudo-second-order kinetics best depict the sorption of Cr, Fe, Pb, Cd, and Zn. This model endorses a chemisorption of the ions through valency forces wherein electron sharing or exchange occurs between either GO or MGO and the metal ions, which act like covalent bonds and ion exchangers. Additionally, the adsorption is influenced by the dosage of the adsorbent and the concentration of metal ions, with a doubling of the GO or MGO dosage resulting in a fourfold increase in metal ion adsorption [48, 53]. The strong correlation between the experimental results and the kinetic models suggests that both physisorption and chemisorption likely occur, with chemisorption being the more dominant mechanism. This result is consistent with earlier researchers who had removed heavy metals using graphene-based adsorbents [54-56].
The Adsorption Kinetics is presented in Eqs. (4 and 5)
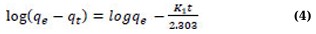
where
t represents the contact time;
K and k1 stand for the pseudo-first-order adsorption model’s rate constants.
Where k2 represents the rate constant.
| Metal Ion | GO | MGO | ||
|---|---|---|---|---|
| R2 | R2 | |||
| Pseudo-first-order | Pseudo-second-order | Pseudo-first-order | Pseudo-second-order | |
| Cr | 0.9379 | 0.9999 | 0.9067 | 0.9835 |
| Fe | 0.9998 | 0.9999 | 0.9968 | 0.9984 |
| Pb | 0.9796 | 0.9925 | 0.9643 | 0.9904 |
| Cd | 0.9796 | 0.9964 | 0.9932 | 0.9923 |
| Zn | 0.9924 | 0.9912 | 0.9643 | 0.9887 |
4. LIMITATIONS
The functionalization of magnetic graphene oxide using supports, organic polymers, and chemical agents should be investigated to enhance its specific surface area and facilitate easy recovery from wastewater. In addition, the project did not incorporate any cost analysis, which would have been important to show whether this method is more economical than other available methods. Furthermore, this research has been restricted to investigations on laboratory scales; thus, larger industrial-scale research should be explored.
CONCLUSION
The objective of this study is to remove heavy metals from wastewater from foundries using magnetic graphene oxide (MGO). Characterizations like SEM, BET, and FTIR confirmed the successful synthesis of both graphene oxide (GO) and MGO. SEM presented the flaky and high surface area nature of GO, while the iron nanoparticles on MGO confirmed successful modification. High specific surface area (1165.220 m2/g) and an abundance of surface functional groups were demonstrated by BET and FTIR for MGO. FTIR showed there were oxygen-containing groups, which packed onto the GO nanosheets, during the process of adsorption; these oxygen groups on the GO surface give metal ions places to bond, verifying the creation of graphene oxide.
This study revealed that the heavy metal removal process using adsorbent actually depended on contact time, adsorbent dosage, and temperature. In the case of longer contact time, there was much stronger interaction between adsorbent and metal ions, as for higher adsorbent doses, this could enhance the active site availability, thereby increasing the removal efficiency. GO was much superior in terms of heavy metals removal efficacy in comparison to MGO, with 95.40, 94.00, 95.80, 94.2, and 95.7% removal of Cr, Fe, Pb, Cd, and Zn, respectively. The values of removal efficiencies by MGO were ever so slightly lower, and this was due to the presence of iron ions on the adsorption sites of GO. Temperature was also an important factor; it had a strong positive effect on higher temperatures in improving adsorption through increased mobility of ions. Though GO exhibited more impressive adsorption capacity, the significant advantage of MGO was that it was extremely easy to separate it from the solution by applying an external magnetic field; thus, the recovery and reuse process was simplified. According to the results obtained, it was clear that adsorption was very effective in removing heavy metal ions.
The adsorption followed the Langmuir isotherm model, indicating monolayer adsorption, whereas the kinetics conformed to the pseudo-second-order model. Both physisorption and chemisorption probably take place, with chemisorption being the more prevalent mechanism, according to the good correlation between the experimental results and the kinetic models.
In conclusion, MGO is a good material to remove heavy metals from wastewater in an efficient way, combining effective adsorption and easy recovery. Further studies could include optimizing the synthesis through a better understanding of the adsorption mechanism and improving the long-term stability and reusability of MGO. Also, the use of green and low-cost synthesis should be employed. Future studies can also be directed toward a combination of GO/MGO along with clays, biopolymers, etc., to improve their adsorption capacity and stability. Other novel regeneration techniques, such as microwave-assisted desorption or the electrochemical method, should also be investigated, which could help in reducing waste generation and improving reuse.
AUTHORS’ CONTRIBUTIONS
All authors have read and agreed to the published version of the manuscript. They have carefully reviewed all results and given their approval for the final manuscript version.
LIST OF ABBREVIATIONS
| SEM | = Scanning Electron Microscopy |
| BET | = Brunauer-Emmett-Teller |
| FTIR | = Fourier Transform Infrared Spectroscopy |
| GO | = Graphene Oxide |
| MGO | = Magnetic Graphene Oxide |
| NPs | = Nanoparticles |
| FeCl3 | = iron(III) chloride |
| FeSO4 | = iron(II) sulphate |
| FeCl3·7H2O | = Ferric chloride heptahydrate |
| Cr | = Chromium |
| Fe | = Iron |
| Pb | = Lead |
| Cd | = Cadmium |
| Zn | = Zinc |
AVAILABILITY OF DATA AND MATERIALS
Data presented in this study are available on request from the corresponding author.
ACKNOWLEDGEMENTS
The authors would like to express their appreciation to Covenant University for its assistance and sponsorship of this paper.