All published articles of this journal are available on ScienceDirect.

Depressurization System by Coiled Pipes Applied to a High Pressure Process: Experimental Results and Modeling
Authors Info & Affiliations
Abstract
Background:
The use of backpressure regulator valves is widespread in high-pressure processes both at laboratory and pilot plant scales, but being a single step for effluent depressurization, such valves may have some limitations at industrial scale. In an effort to improve the depressurization step, this work studies a system based on the pressure drop of a fluid that circulates through coiled pipes.
Method:
The equipment, based on three series of variable length coiled pipes, was installed to achieve depressurization of 240 bars in a SCWO pilot plant.
Results:
The experimental results were compared with those obtained by the modeling carried out using different friction factor correlations from the literature.
Conclusion:
Among all the correlations tested, the Lockhart–Martinelli correlation showed the best agreement with experimental data. However, it was necessary to obtain an appropriate C parameter to achieve a good agreement with experimental data.
1. INTRODUCTION
Industrial wastewaters are produced in ever-increasing quantities, and their treatment by conventional technologies is sometimes problematic and harmful to the environment. Among high temperature and pressure processes, Supercritical Water Oxidation (SCWO) is a powerful wastewater treatment technology that always operates above the critical point of pure water (Tc = 374 ºC and Pc = 221 bar), thus allowing the very effective destruction of a wide range of dangerous wastewaters [1]. A typical SCWO process involves several steps in which it is necessary to work at high pressure and temperature [2], including pressurization, heating, reaction, cooling, depressurization, and phase separation. Almost all studies reported in the literature in the last few decades were performed on the laboratory and pilot plant scales, where the depressurization step is easily carried out with a backpressure regulator valve. However, the use of this kind of valve is not particularly suitable when SCWO is applied on an industrial scale, where the high flowrates and the presence of solid particles, amongst other factors, may exacerbate the problems of valve erosion [3].
In this sense, an adequate control of pressure system is very important in the SCWO plant operation. The pressure operation in whole plant depends on the depressurization system, therefore, it must guarantee a stable and controllable operation, capable to absorb possible pressure changes produced. Especially in the reactor where temperature is higher, these pressure changes could exceed the material pressure limit, endangering the system performance. To solve this situation, Soria [4] suggested several steps to reduce the pressure, using different valves located in several lines. Thus, it is possible to diminish the flow in each line allowing a better regulation. However, when effluents contain suspended solids, valve erosion due to extreme velocities is produced when pressure decreases from 250 to 5 bar. For those cases, O’Regan et al. [5] proposed the use of coil pipes or even the combination of both coil pipes and valves in order to improve the operation. In this way, at industrial scale, several commercial SCWO plants of different companies like Hydroprocessing (HydroSolid, Texas), Hanwha Chemical Corporation (Korea), Chematur Engineering AB (AquaCritox, Sweden) have installed coil pipes as depressurization system [6]. However, there is a lack of scientific studies about the behavior and modeling of coil pipes in SCWO plants.
The use of coiled pipes provides a different way to achieve a gradual pressure change along the pipe length [7, 8]. Thus, it is possible to redistribute the mechanical stress along the length of a coiled pipe rather than producing an abrupt pressure change in a single valve. In addition, the installation and maintenance of coiled pipes are easier and more economical, thus making it possible to install different parallel coiled pipes to operate without stopping the process when maintenance is required due to erosion problems.
Coiled pipes have been used in a wide variety of industrial applications due to their many practical advantages, such as compactness, ease of manufacture, and high efficiency in heat transfer. In coiled pipes the pressure drop is higher than that produced in straight pipes at the same flowrate and pipe length. This fact can be explained by the secondary flow that is induced because of centrifugal forces, and different axial velocities. The presence of the secondary flow dissipates kinetic energy, thus increasing the resistance to flow. As a consequence, the transition from laminar to turbulent flow, which is marked by the critical Reynolds number (Recr), in coiled pipes is as high as 6000 to 8000 while in straight pipes Recr is approximately 2100. For that reason, the pipe’s diameter must be selected to achieve the necessary velocities to work in turbulent flow. In this way, it is possible to increase the pressure drop reducing the necessary length and at the same time, it is possible to avoid nucleation and solid deposition, preventing obstructions in pipes. Because of high velocities and centrifugal forces, erosion increases along the pipe wall. For that reason, different parallel coil systems can be installed to manage continuous operation even in the case of failure of a coil.
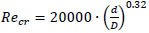
To obtain the critical Reynolds number in coiled pipes, Ito [9] suggested the following correlation.
 |
(1) |
Where d is the inner diameter of the pipe and D is the diameter of the coiled pipe.
The prediction of pressure drop in coiled pipes is an essential step in the design of a depressurization system for SCWO. In the present work, a system of coiled pipes was used in the depressurization step of a SCWO pilot plant where the pressure drop required was around 230–240 bar.
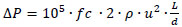
The pressure drop can be calculated using the Fanning friction factor according to the following equation:
 |
(2) |
Where ΔP is the pressure drop in bar, L is the coil section length in m, d is the diameter of the pipe in m, ρ is the density in kg m-3, u is the velocity in m s-1, and fc is the friction factor.
Several correlations of friction factors were studied in order to analyze the pressure drop behavior and to compare the predicted results with the experimental data. Typical pressure drop values for fluids circulating through these types of systems have been widely reported in the literature for both single-phase and two-phase systems under turbulent conditions [10]. The correlations chosen for this work are summarized in Tab. 1 and outlined below.
a) Correlations that consider single-phase flow:
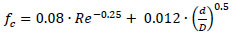
In single-phase, the Fanning friction factor in coiled pipes (fc) was calculated using correlations proposed by different authors. White [11] suggested the first correlation for smooth pipes, which is useful as a first approximation.
 |
(3) |
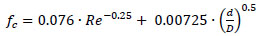
Ito [9] suggested a theoretical equation:
 |
(4) |
Mishra and Gupta [12] also proposed a correlation for a coiled pipe:
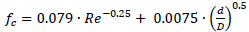 |
(5) |
b) Correlations to consider two-phase flow.
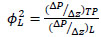
For two-phase flow, the Lockhart–Martinelli [13] correlation is most commonly used to determine pressure drop in straight pipes. Pressure drops of individual phases are calculated assuming that each phase is circulating alone through the pipe. The pressure drop multipliers for gas and liquid (ɸG2 and ɸL2) are the ratios between the two-phase pressure drop
((ΔP/ Δz)TP) and each individual phase pressure drop ((ΔP/ Δz)G and (ΔP/ Δz)L):
 |
(6) |
 |
(7) |
The Lockhart–Martinelli parameter (χ2) links liquid and gas pressure drop to obtain the two-phase pressure drop.
 |
(8) |
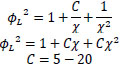
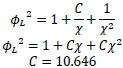
The following equations were proposed to determine the liquid and gas multipliers:
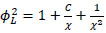 |
(9) |
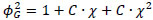 |
(10) |
Where C is a parameter with values ranging from 5 to 20 depending on the flow regime for liquid and gas phases.
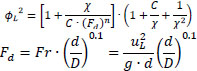
Based on the Lockhart–Martinelli correlation, Awwad et al. [14] and Xin et al. [15] proposed new correlations for horizontal coiled pipes with an air/water flow. Awwad et al. [14] found that the superficial velocities (uL) had a significant effect and therefore, proposed a new equation in which this effect is considered to calculate the multipliers:
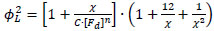 |
(11) |
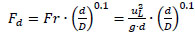 |
(12) |
where C and n values depend on non-dimensional parameter; if Fd
However, Xin et al. [15] found a value of C = 10.646 in the Lockhart–Martinelli equation to adapt it for coiled pipes.
In the work described here, the study of a system of coiled pipes as an alternative depressurization system for the SCWO process is carried out. All the correlations included in Table 1 were studied with the aim of calculating a friction factor that represents the depressurization step from supercritical to ambient pressure. The value obtained was consistent with the experimental data obtained in the tests carried out. It is important to note that the correlations that appear in the literature where used with pressure drops of less than 20 bar, in processes completely different to SCWO. In the case considered in this work, the pressure drop is markedly higher, with a value of around 250 bar, therefore all correlations have been applied to conditions never studied before.
| Authors | Correlation | Conditions | |
| Correlations for Friction factor coiled pipes considering single-phase flow | |||
| White [11] | fc=0.08∙Re-0.25+0.012∙(d/D)0.5 | Smooth pipes, empirical, turbulent flow 15000<Re<100000 |
|
| Ito [9] | fc=0.076∙Re-0.25+0.00725∙(d/D)0.5 | Theoretical ,turbulent flow 0.034<Re(d/D)2<300 |
|
| Mishra and Gupta [12] | fc=0.079∙Re-0.25+0.0075∙(d/D)0.5 | Empirical, turbulent 4500<Re<105 |
|
| Correlations for Friction factor considering two-phase flow | |||
| Lockhart-Martinelli [13] | 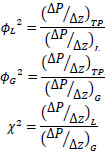 |
 |
Gas-liquid |
| Awwad et al. [14] |
 |
Air-water 12.7<d<38.1 mm 330<D<670 mm 0.008<UL<2.2 m s-1 0.2<UG<50 m -1 |
|
| Xin et al. [15] |
 |
Air-water 12.7<d<38.1 mm 305<D<609 mm 0.008<UL<2.2 m-1 0.2<UG<50 m-1 |
|
2. MATERIALS AND METHODS
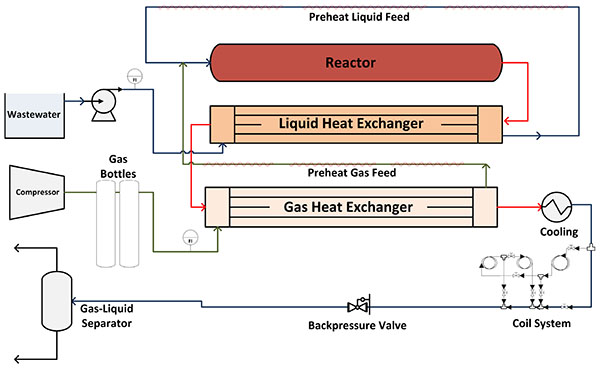
Fig. (1) shows the schematic diagram of the pilot plant in which the experiments were carried out. The performance of this pilot plant has been satisfactorily tested for the SCWO process using different wastes [16-19]. In a normal operation for wastewater oxidation, the liquid feed, which is composed of water and organics, is pumped at a flowrate in the range 250–420 g min-1 at 250 bar, which is the normal operating pressure. The oxidant stream (air is used) is stored and pressurized by a compressor in an accumulating tank before adding to the system. The two streams are preheated separately in liquid and gas heat exchangers, respectively, taking advantage of the reactor effluent energy. In addition, it is necessary the use of electrical heater during the start-up step until the autothermal state is achieved. When operating conditions are reached, the two streams are mixed before entering the reactor, where the waste is oxidized by exothermic reactions and the effluent temperature increases. The temperature reached ranged from 450 to 550°C before entering into the heat exchangers, where the effluent temperature decreases up to 150ºC. However, another cooling is necessary to reduce the temperature below 50ºC. Then, the depressurization system reduces the pressure from operating conditions (250 bar) to ambient pressure. Finally, gas and liquid stream are separated in a gas-liquid separator
In the original pilot plant, the depressurization system consisted of a backpressure regulator valve, which took all of the mechanical stress produced by the great pressure change. In this work, a series of coiled pipes was installed in order to study an alternative approach to enhance the operation and to facilitate maintenance by achieving a gradual pressure change. In this way, with the backpressure valve fully open, the coil system must reduce the operating pressure through the pressure drop produced.
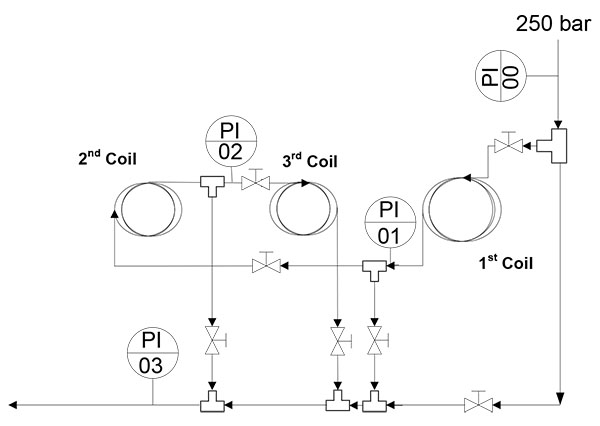
A schematic diagram of the new depressurization system is shown in Fig. (2). It can be seen that this system was designed with different coil sections to allow effluent circulation through each one, either individually or in series. All coil sections were made of stainless steel (AISI 316L) pipe with an inner diameter of 1.0795 mm and a coil diameter of 16.5 cm. In addition, the valves and bypass in the system make it is possible to circulate the fluid through one, two, or three sections of coiled pipe depending on the length required to achieve the desired pressure drop. The inlet and outlet pressure of each coiled pipe was monitored using four pressure transmitters (PI00 to PI03 in Fig. (2)) linked to a data acquisition system.
Several blocks of experiments were carried out in order to obtain the pressure drop data for different coil lengths. The coil pipes used in each block had different lengths, making it possible to obtain the pressure at different distances from the beginning of the coil system. The blocks of experiments are shown in Table 2 along with the corresponding lengths of coil pipes used. The length of each section of coil pipe is shown in the middle column and the coil pipe lengths in the right-hand column are those where pressure data were obtained using the pressure gauge in (Fig. 2).
| Experiments | Length (m) | Length for Pressure measurements (m) | ||||
| 1st coil | 2nd coil | 3rd coil | PI 01* | PI 02* | PI 03* | |
| Block 1 | 3 | 4 | 4 | 3 | 7 | 11 |
| Block 2 | 4 | 2 | 2 | 4 | 6 | 8 |
| Block 3 | 4 | 3 | 2 | 4 | 7 | 9 |
| Block 4 | 5 | 4 | 4 | 5 | 9 | 13 |
| Block 5 | 6 | 3 | 2 | 6 | 9 | 11 |
| Block 6 | 8 | 3 | 1 | 8 | 11 | 12 |
| Block 7 | 8 | 3 | 2 | 8 | 11 | 13 |
| Test | Water flow (g min-1) |
Gas flow (g min-1) |
Coil Length (m) | ||||||||||
| 0 | 3 | 4 | 5 | 6 | 7 | 8 | 9 | 11 | 12 | 13 | |||
| 1 | 256.67 | 70 | 0 | 35 | 60 | 69 | 85 | 100 | 113 | 124 | 169 | 206 | 248 |
| 2 | 256.67 | 80 | 0 | 38 | 66 | 73 | 88 | 103 | 119 | 133 | 179 | 240 | 264 |
| 3 | 256.67 | 90 | 0 | 40 | 71 | 75 | 89 | 106 | 123 | 135 | 185 | 256 | 278 |
| 4 | 256.67 | 100 | 0 | 46 | 76 | 81 | 93 | 111 | 135 | 144 | 215 | 269 | 291 |
| 5 | 306.67 | 70 | 0 | 43 | 80 | 89 | 95 | 118 | 134 | 160 | 206 | 265 | 279 |
| 6 | 306.67 | 80 | 0 | 49 | 85 | 91 | 100 | 125 | 145 | 167 | 231 | 285 | - |
| 7 | 306.67 | 90 | 0 | 50 | 88 | 93 | 104 | 130 | 155 | 203 | 274 | - | - |
| 8 | 306.67 | 100 | 0 | 58 | 92 | 97 | 110 | 136 | 165 | 218 | 288 | - | - |
| 9 | 356.67 | 70 | 0 | 65 | 84 | 108 | 128 | 163 | 185 | 198 | 273 | - | - |
| 10 | 356.67 | 80 | 0 | 67 | 92 | 109 | 143 | 173 | 195 | 220 | 290 | - | - |
| 11 | 356.67 | 90 | 0 | 68 | 96 | 111 | 160 | 191 | 209 | 271 | - | - | - |
| 12 | 356.67 | 100 | 0 | 70 | 98 | 112 | 172 | 203 | 227 | 282 | - | - | - |
| 13 | 410 | 70 | 0 | 72 | 96 | 118 | 155 | 205 | 235 | 268 | - | - | - |
| 14 | 410 | 80 | 0 | 73 | 98 | 123 | 167 | 216 | 243 | 283 | - | - | - |
| 15 | 410 | 90 | 0 | 76 | 108 | 135 | 180 | 229 | 276 | - | - | - | - |
| 16 | 410 | 100 | 0 | 78 | 117 | 143 | 195 | 236 | 285 | - | - | - | - |
Pressure data measurements were repeated in duplicates and a good reproducibility of the results was verified. In these cases, an average value was taken as the final result.
Moreover, in order to assess the influence that the air and water flowrate had on the pressure drop, several tests were carried out for each block of experiments. In total, 16 tests were performed in each block, i.e., four different water flowrates (257, 307, 357 and 410 g min-1) and four air flowrates (70, 80, 90, and 100 g min-1) for each block. In this way, it was possible to obtain the pressure drop as a function of coil pipe length for each test.
It should be noted that in all tests carried out in this study the pilot plant reactor was at supercritical conditions, where the circulating fluids are very compressible. This fact is really important to adequately represent the behavior of a SCWO plant. In other words, despite the depressurization system is not at supercritical conditions (because temperature is below 50ºC), the behavior of a flowing system under pressure is strongly affected by the presence of a compressible medium in a part of the plant. On the other hand, a wastewater was not fed into the system to ensure that the flowrate of air and water remained constant when they reached the depressurization system, achieving an accurate characterization model. However, the performance of coil pipes will be the same in those cases in which oil emulsions (oil in water or gas in oil) are fed, since in a supercritical water oxidation plant, most of the oil present will be completely oxidized along the reactor generating gases as CO2, so the oil amount would be drastically reduced in the effluent. For this reason, when emulsions are fed to a SCWO plant, the effluent before the depressurization step will be a mixture of gas and water with similar properties to those of the air-water mixture tested in this work. The pressure of the mixture of gas and water contained in the effluent is gradually reduced along the coils length and therefore the formation of bubbles in the system is not a problem.
3. RESULTS AND DISCUSSION
3.1. Experimental Tests
Experimental data were recorded for coil sections of different lengths (see Table 2) in order to study the pressure drop as a function of coil length. In addition, flowrates in the range 250–410 g min-1 for the water stream and 70–100 g min-1 for the air stream were studied to determine the influence of these parameters on the depressurization process. The pressure drops in coiled pipes are listed in Table 3 for each set of test and flowrate conditions.
It can be seen from the results in Table 3 that the highest pressure drop achieved was 290 bar, with 300 bar being the pilot plant safety limit. The data in Table 3 therefore cover all possible operation ranges for the conditions studied. The influence of air and water flowrates on pressure drop is discussed in the following section.
3.2. Behavior of the Coil System for Different Gas Flowrates
The air flowrate to be fed in a SCWO plant must be varied depending on the wastewater concentration to be treated. For this reason, it was necessary to study the influence of this variable in the depressurization step. Under typical conditions, the pilot plant operates with air in excess in order to ensure the total oxidation of the organic material in a wastewater. As a consequence, when reactions take place and the effluent is cooled, the stream before the depressurization system contains the initial nitrogen fed into the system and the excess oxygen after the reactions.
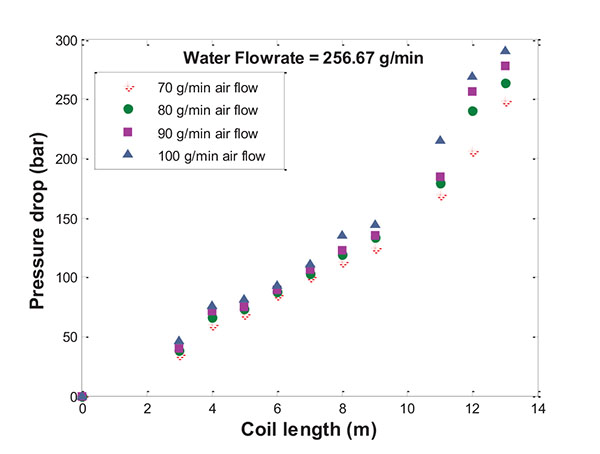
The experimental data that show the influence of gas flowrate on the total pressure drop in coiled pipes are plotted in Fig. (3) for a fixed liquid flowrate of 256.67 g min-1 of water. Therefore, the total flow increases because of gas flowrate. The total flowrate of these tests are 326.67, 336.67, 346.67 and 356.67 g min-1 resulting in a gradual mass gas fraction increase. It can be seen that, as one would expect, an increase in the gas flowrate leads to an increase in the pressure drop. Therefore, the pressure drop along the length of the coils is cumulative. At the end of coil, i.e., at 13 m, the pressure drop difference for each increase in air flowrate of 10 g min-1 is around 15 bar.
3.3. Behavior of the Coil System for Different Liquid Flowrates
In a similar way to the gas flowrate, the liquid flowrate has a significant influence on the depressurization step. Tests were therefore carried out at different liquid flowrates in order to assess how the pressure drop could be increased by varying this factor.
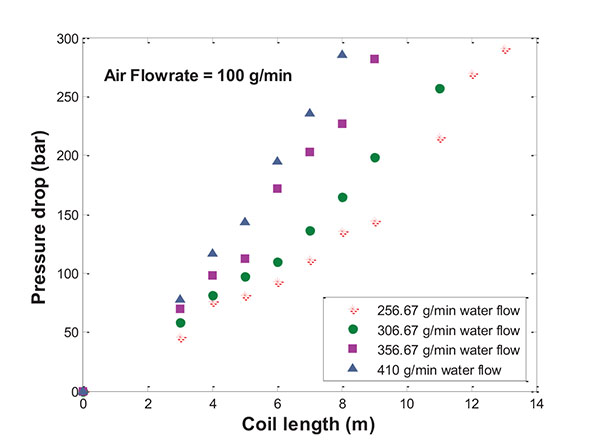
As was expected, for a given length of coil selected an increase in the liquid flowrate leads to a greater pressure drop. The experimental data taken along the coiled pipes with different liquid flowrates are represented in Fig. (4). On maintaining a fixed gas flowrate of 100 g min-1, when liquid flowrate increases, the total flow also increases, ranging from 356.67 to 510 g min-1. Consequently, the mass liquid fraction also varies from 71.96 to 80.39%. It can be seen that the coil length required to achieve the pressure drop decreased as the water flowrate was increased. The test was carried out in the ranges from 13 m with 256.67 g min-1 water flow to 8 m with 410 g min-1 water flow.
It is important to point out that in all cases the use of coils for the pilot plant depressurization was completely satisfactory and led to stable flowrates and constant pressure throughout the system.
In order to extrapolate the above information to other coils and pipe diameters on working under similar conditions, the friction factor correlation that best represents the behavior of the system is proposed below. In order to achieve this goal, a mathematical model was developed to simulate different friction factors taken from the literature. The model enables a comparison of the experimental and simulated data. A study of single and two-phase systems was carried out by analyzing correlations of the friction factor that provide the best fit. The influence of water and air flow was also studied.
3.4. Mathematical Model
The finite elements method was used to build the mathematical model to simulate the pressure drop along the coils. As a result of the huge pressure reduction, the values of density, viscosity and Reynolds number vary markedly and these must be studied by finite elements. In contrast, temperature before depressurization step is very next to ambient temperature (25-35 ºC), so fluids properties have been calculated with a constant temperature of 30ºC. All variables are one-dimensional in the stationary state and well mixing is assumed in every finite element, since the flow field is fully turbulent within the coils [7]. It is important to note that the consideration of a water-air mixture to calculate the properties of the medium is a very accurate approximation for SCWO effluents in the pilot plant, where the majority compounds are water, oxygen (added in excess) and nitrogen, all of them taken into account in the mixture properties calculation. The gases generated in the oxidation process (mostly CO2 and CO) are a minority compared with the rest, while in the liquid, organics are removed almost completely (efficiency higher than 99%) and pure water can be assumed.
Engineering Equation Solver (EES) [20] was used to develop the model. The basic function provided by EES is the solution of a set of algebraic equations, including a database for thermodynamic and transport properties of the substances considered. The thermodynamic properties of water were implemented using the IAPWS formulation [21]. The properties of air were implemented using an equation of state developed by Lemmon et al. [22]
The pressure drop for each finite element was calculated using Eq. (2). The different friction factor correlations showed in Table 1 were used to compare the experimental data obtained with simulated results. In this step, both single-phase analysis and two-phase analysis were considered.
3.4.1. Single-Phase Analysis
As a first approximation, the pressure drop in coiled pipes was calculated using single-phase correlations (Eq. 2 – Eq. 4) to determine the friction factors. In order to evaluate the properties of the feed, two different approximations were tested. First, the feed was assumed to be pure water and, second, the feed properties were considered from a mixture of air and water, but assuming to be a monophasic fluid. In this case, the properties of the mixture such as density and viscosity were evaluated through a mass average [23] according to the following equations.
 |
(13) |
Where Q is the volumetric flowrate in m3 s-1 and µ is the viscosity in kg m-1s-2, subscripts L and G represent the variable evaluated for the liquid phase and gas phase, respectively.
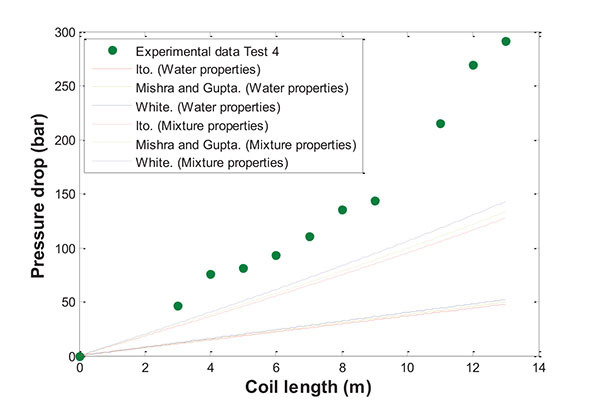
The experimental data from Test 4 Table 3 were used to analyze the results obtained from the simulations carried out under the conditions outlined above, i.e., first using the properties of pure water and then those of the mixture water/air
It can be seen from the results in Fig. (5) that in both cases there is a lack of agreement between the experimental and simulated data. The use of the properties of pure water gave the worst results, demonstrating that the effect of air is quite important. The simulated results are closer to the experimental data when the mixture properties were used, but it is clear that single-phase correlations are not suitable to fit the experimental data. The interaction between gas and liquid phases during the depressurization step is quite important, and the phase of the gas is more affected than the liquid during depressurizing because the pressure and temperature abruptly changed. For those reasons it is not possible to consider the flow of a monophasic fluid to represent the experimental data. As a consequence, new friction factor correlations were required to improve the results obtained and the two-phase correlations are discussed below.
3.4.2. Two-Phase Analysis
As expected, the results obtained with single-phase correlations differed significantly from the experimental data and new simulations were therefore carried out using two-phase friction factor correlations. The correlations of Lockhart–Martinelli [13], Awwad et al. [14], and Xin et al. [15] were implemented in the mathematical model. In this case, the liquid and gas properties were calculated separately for each phase pressure drop and then the total pressure drop was calculated based on the correlation proposed by each author (Eq. (5) – Eq. (11)). In the case of the Lockhart–Martinelli correlation, different values for the parameter C were tested.
The experimental data from Test 4 were again used as a reference. The results obtained for each correlation are represented in Fig. (6).
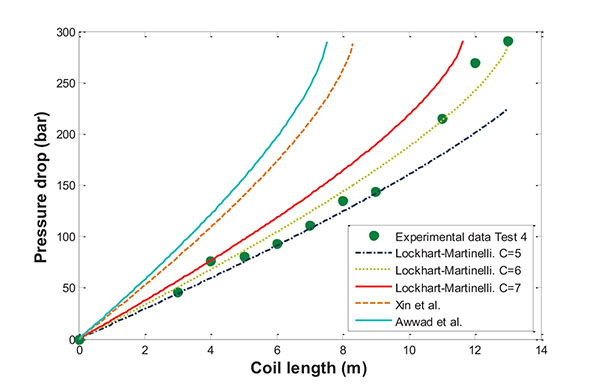
Curiously, simulations carried out with friction factors obtained for two phases in coiled pipes (Xin et al. and Awwad et al.) were not consistent with the experimental data, with the total pressure drop in coils overestimated in these cases. However, the Lockhart–Martinelli correlation with C values between 5 and 7 fits the experimental data very well.
In this point, it is necessary to highlight the specific operation conditions in this work. The most significant the high pressure drop obtained, but also are important the use of different inner and coil diameters. While in most studies, the ratio d/D is ranged from 0.0208 to 0.12, in this case, this parameter is notably lower, that is 0.00654. This is because the inner diameter (1.0795 mm) is much smaller than the diameter of the coil (16.5 cm), thus the mechanism is well defined using Lockhart-Martinelli correlation with the appropriate C parameter. This assertion is consistent with the results reported by authors as Rippel et al. [24] and Banerjee et al. [25]. According to them, most of pressure drop data for two phases flow through coiled pipes are well represented by the Lockhart-Martinelli correlation, with the specific definition of the C parameter.
In this way, the results of each test were analyzed in order to determine the optimum value of the C parameter.
3.4.3. Fitting data
As mentioned above, according to the Lockhart–Martinelli correlation [13] the C parameter has a value between 5 and 20 for straight pipes depending on the flow regime for the liquid and gas phases. Xin et al. [15] investigated the effects of coil geometries and flowrates for air and water in annular horizontal helical pipes with different pipe diameters. They found an optimum value of 10.646 for the C parameter to estimate the two-phase multipliers for friction factors.
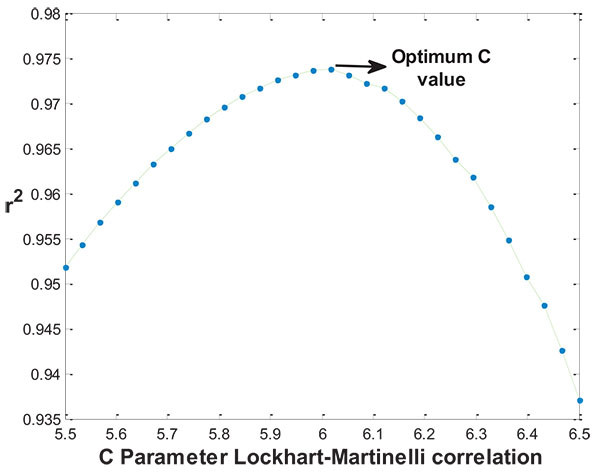
In the same way that Xin et al. proposed and based on Lockhart–Martinelli correlation, this study determines the optimum C parameter to obtain a suitable correlation for the great pressure drop produced in SCWO plants, that is, from supercritical pressure to ambient conditions (∆P>220 bar). In order to achieve this goal, for each experimental test several simulations were carried out in which the C value was varied and the coefficient of determination (r2) was analyzed to measure the goodness of fit and to obtain the best value in agreement with the data test. As an example, the study performed for Test 4 is shown in Fig. (7), where the C parameter ranged from 5.5 to 6.5. In this case, the optimum C value was 6.017 with an r2 of 0.9739.
The results of each test were analyzed to obtain the optimum C values and the results are shown in Table 4. It can be seen that all optimum C values are in the range between 6 and 7. The narrow range of optimum values obtained means that the average value C = 6.260 ± 0.1 can be used to represent all of the cases studied.
| Water Flowrate (g min-1) | 257 | 307 | 357 | 410 | |||||
| Test | Coptim | Test | Coptim. | Test | Coptim. | Test | Coptim. | ||
| Air Flowrate (g min-1) |
70 | 1 | 6.272 | 5 | 6.310 | 9 | 6.431 | 13 | 6.855 |
| 80 | 2 | 6.265 | 6 | 6.172 | 10 | 6.465 | 14 | 6.562 | |
| 90 | 3 | 6.034 | 7 | 6.034 | 11 | 6.251 | 15 | 6.327 | |
| 100 | 4 | 6.017 | 8 | 6.013 | 12 | 6.189 | 16 | 6.120 | |
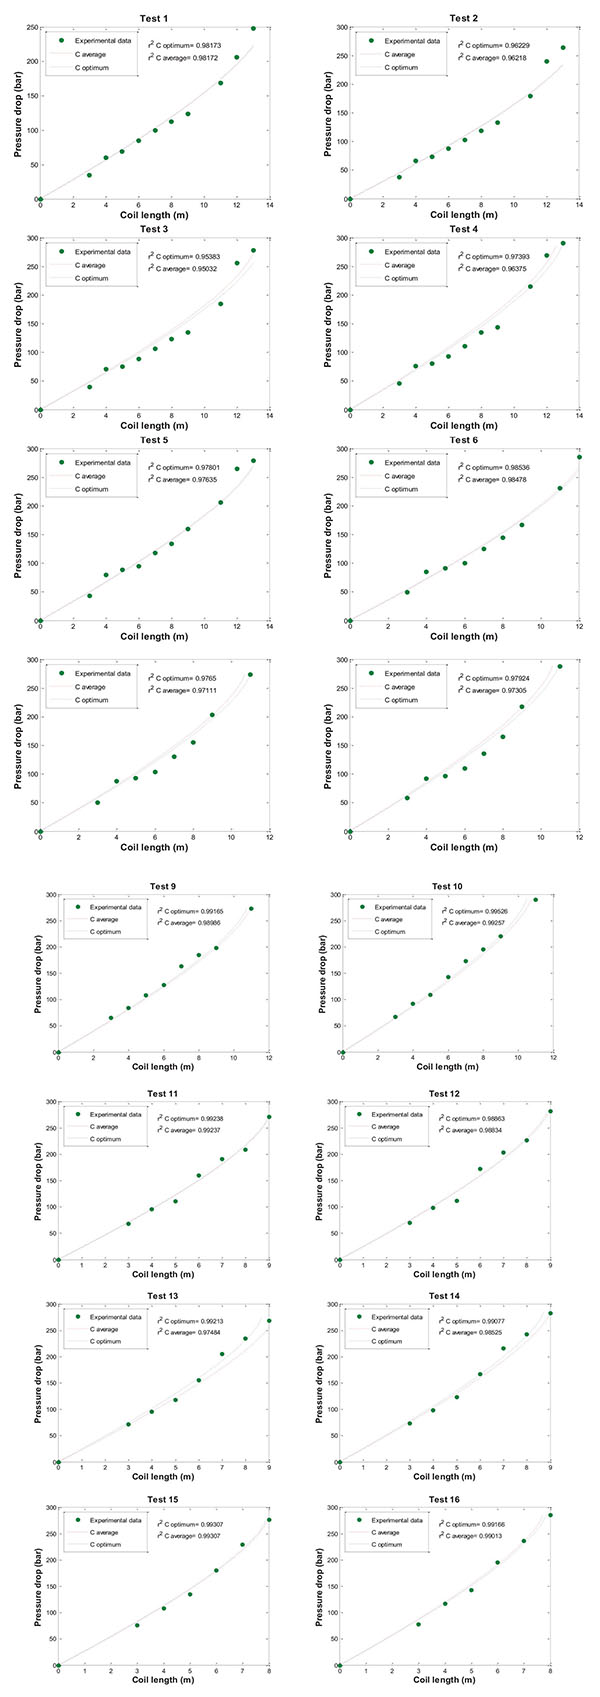
The experimental data obtained for all tests performed are shown in Fig. (8) along with a comparison of simulated pressure drops obtained using the optimum C and the average C parameter. Firstly, the good agreement between experimental and simulated data can be seen and, in all cases, a coefficient of determination (r2) higher than 0.95 was obtained. In addition, the average C parameter in Table 4 satisfactorily represents all cases, with only some minor differences observed. Therefore, the use of an average C parameter for the conditions studied, with a ratio d/D of 0.0654, is suitable to predict the two-phase friction factor for the depressurization step for a reduction in pressure from supercritical to ambient.
CONCLUSION
The study presented here demonstrates that it is possible to efficiently use a system of coiled pipes instead of a backpressure regulator valve for the depressurization step in an SCWO pilot plant. The length of coiled pipe can be selected by three coils in series, therefore adjusting the pressure drop needed for different liquid and gas flowrates. This approach ensures stable and controlled system operation, in spite of the fluid compressibility because of supercritical conditions in the reactor.
In order to predict the behavior of the depressurization step from supercritical to ambient pressures, friction factor correlations were used to fit the experimental data. An assessment of correlations from the literature showed that single phase correlations are not applicable. Instead, the Lockhart–Martinelli correlation, which is used for two-phase flow in straight pipe, shows a good fit with the experimental data. An analysis was carried out to determine the optimum value of the C parameter and an average of 6.260 ± 0.1 was appropriate to achieve good agreement between simulated results and experimental data.
NOMENCLATURE
| C | = Lockhart-Martinelli regime flow parameter |
| d | = pipe diameter (m) |
| D | = coil diameter (m) |
| f | = Fanning friction factor |
| Fd | = non dimensional parameter |
| Fr | = Froude number |
| g | = acceleration of gravity (m s-2) |
| L | = coil length (m) |
| n | = constant |
| Q | = volumetric flowrate (m3 s-1) |
| Re | = Reynolds number |
| u | = velocity (m s-1) |
| Greek symbols | |
| ΔP/Δz | = pressure drop per unit length (bar m-1) |
| µ | = viscosity (kg m-1s-2) |
| ρ | = density (kg m-3) |
| Ø2 | = pressure drop multipliers |
| χ2 Lockhart | = Martinelli parameter |
| Subscripts | |
| c | = coil |
| cr | = critical |
| G | = gas |
| L | = liquid |
| TP | = two-phase |
ETHICS APPROVAL AND CONSENT TO PARTICIPATE
Not applicable.
HUMAN AND ANIMAL RIGHTS
No Animals/Humans were used for studies that are base of this research.
CONSENT FOR PUBLICATION
Not applicable.
CONFLICT OF INTEREST
The authors declare no conflict of interest, financial or otherwise.
ACKONWLEDGEMENTS
This research was supported by Projects P07-RNM-03276 and P11-RNM-7048 promoted by the Junta de Andalucía (Spain). The authors are also grateful to Agrifood Campus of International Excellence (ceiA3) from the Spanish Ministry of Education for the research grant received.