All published articles of this journal are available on ScienceDirect.

Optimization of Dissolution Conditions During Fractionation of Corn-cob in ZnCl2.4H2O/Urea Solvent System: A Statistical Approach
Abstract
Background and Objectives:
The choice of a suitable pretreatment method and the adjustment of the pretreatment parameters for efficient conversion of biomass to value-added products is crucial to a successful biorefinery concept. Pretreatment of corn cob using ZnCl2.4H2O/ Urea was carried out and optimized in this study.
Methods:
Effect of pretreatment conditions on cellulose recovery, hemicellulose recovery during the pretreatment of corn cob using ZnCl2.4H2O/ Urea was investigated via response surface methodology approach and optimized in this study. Experimental results were analysed and appropriate predictive empirical linear models were developed for each response.
Results:
For cellulose recovery, time and temperature, and solvent concentration were significant factors. Hemicellulose recovery in the liquid fraction is impacted by time and solvent concentration, while lignin recovery is affected by time and temperature. Using numerical optimization by desirability function, optimum pretreatment conditions obtained were: 90 min, 120°C and concentration of 71.32%/28.68 (w/w) ZnCl2.4H2O/ Urea. At these conditions, the predicted recovery for cellulose, hemicellulose and lignin were 99.03%, 27.18% and 72.43%, respectively, with a desirability of 0.902. The actual recovery was 91%, 29% and 68% for cellulose, hemicellulose and lignin, respectively, at the same conditions.
Conclusion:
These results indicate that the investigated variables have pronounced effect on the pretreatment of corn cob. Therefore, optimum conditions are required for recovery of desired composition before conversion to value-added products.
1. INTRODUCTION
To reduce our dependence on petroleum based sources and mitigate global climate change, Alternative and renewable fuels derived from lignocellulosic biomass need to be investigated [1]. The energy from lignocellulosic biomass can be utilized directly through combustion to produce heat. The other form of utilization is by converting and upgrading biomass into more valuable and usable forms such as fuel oil, fuel gas or higher value products for utilization in the chemical industry [2].
Corn-cob as well as other lignocellulosic biomass, are composed mainly of cellulose, hemicellulose and lignin. Cellulose is a crystalline structure formed from microfibrils which are composed of glucose monomers linked by hydrogen bonds while hemicellulose is made of polymers containing mainly xylose and arabinose monomers [3]. Lignin, on the other hand acts as a barrier which protects cellulose and hemicellulose from biological degradation. Lignin is a heavily cross-linked amorphous aromatic hetero polymer which consists of phenyl propane monomers p-coumaryl alcohol, sinapyl alcohol and coniferyl alcohol linked by C−C bonds and C−O−C [4]. Therefore, biochemical conversion of biomass results in reduced greenhouse gases in addition to the reduction of harmful by-products. This bioconversion process consists of a pretreatment step that breaks apart the major components of the biomass, increasing the surface area for attack from enzymes to produce monosaccharide sugars such as glucose and xylose. Thereafter, a fermentation step occurs which uses microorganisms to produce chemicals such as ethanol, succinic acid and lactic acid [5].
Developing effective pretreatment methods and finding optimal operating conditions can contribute to overcoming the cost barriers of biomass utilization. To effectively utilise lignocellulosic resources, new pretreatment technologies are needed to overcome the barriers associated with the conversion of biomass to chemicals and fuels [6]. These much needed breakthroughs include improvement of pretreatment processes that are able to fractionate biomass to the main components of lignin, cellulose and hemicellulose in high volumes in order to improve overall biomass utilisation [7].
Modelling and optimization of pretreatment processes can be carried out using methods such as One-Variable-At-A Time (OVAT) method, artificial intelligence tools such as Neural Network (ANN), Genetic Algorithm (GA) [8], fuzzy logic, ant algorithm and particle swarm optimization and mathematical [9], and statistical-based modelling tools such as Response Surface Methodology (RSM). The OVAT method is time-consuming and fails to consider any possible interaction between the factors. Artificial intelligence tools such as ANN and GA are highly efficient, capable of handling incomplete data and deals with non-linear problems at high speeds [10]. ANN was used by Valim et al. (2017) and Valim et al. (2018) to study the delignification process of sugarcane bagasse via hydrogen peroxide (H2O2) and supercritical carbon dioxide (ScCO2), respectively [11, 12]. However, there are several limitations associated with these such as the data size required to provide adequate information (>20) for the training of neural networks. Furthermore, there is difficulty in determining the optimal factors which influence the model development stage of the method such as data division and pre-processing, network architecture suitability and validation of models [13].
Response Surface Methodology (RSM) is the most popular statistically-based optimization strategy which uses a quadratic polynomial model to establish optimal conditions [14]. RSM is used in investigating the effects of individual as well as interactive effects of factors in a process. An efficient alternative to factorial design is Central Composite Design (CCD), this design is popularly used for second order response surfaces [15]. Determining the optimal operating conditions for effective pretreatment techniques can contribute to overcoming the cost barriers associated with the use of biomass by reducing the number of experimental trials needed to evaluate multiple parameters and their interactions [16]. RSM has been successfully applied in the study and optimization of chemical pretreatment by ionic liquids [17], alkaline peroxide [18], alkaline and dilute acids [19]. In addition, the Central Composite Design (CCD) of RSM has previously been successfully applied in the optimization of several pretreatment processes [5, 9].
Previously, a pretreatment solvent (ZnCl2.4H2O/Urea) was identified that effectively fractionated the corn cob into cellulose, hemicellulose and lignin with high recovery of cellulose in the solid fraction and high recovery of hemicellulose in the liquid fraction. The optimization of the solvent and the conditions under which the solvents operate are widely important, not only for the overall improvement of the process but also from an economic perspective. The improvement of the pretreatment would increase the yield and quality of products from downstream processes such as enzymatic hydrolysis and fermentation [20].
In this study, the effect of pretreatment conditions (time, temperature and solvent concentration) on the use of ZnCl2. 4H2O/ Urea molten hydrate was investigated and optimized for the fractionation of corn cob. RSM was adopted to investigate the effect and optimize the pretreatment conditions for fractionating cellulose, hemicellulose and lignin of corn cob. The main and interaction effects of the parameters were studied. CCD, a class of three level complete factorial design was used as a design experiment which considered pretreatment time, temperature and solvent concentration as the independent variables and the responses were % recovery of cellulose, % recovery of hemicellulose and % recovery of lignin.
2. MATERIALS AND METHODS
2.1. ZnCl2.4H2O/ Urea Pretreatment
The pretreatment was carried out at varying temperatures (60-90 °C) in a shaking incubator for varying times (60-120 min) using ZnCl2.4H2O/ Urea at varying concentration ratios (50-90% w/w) (Table 1) at a constant biomass to solvent ratio of 1:10 (5 g dry biomass will be added to 50 g of each solvent) and at a constant agitation speed of 270 rpm. The slurries obtained from each pretreatment method were recovered and separated into solid and liquid fractions by vacuum filtration.
2.2. Compositional Analysis of Solids
The compositional analysis of biomass were analysed for hemicellulose, lignin, extractive and ash content as documented by the National Renewable Energy Laboratory (NREL) following Laboratory Analytical Procedures (LAP TP-510- 42618, 42619, 42622) [21-23].
2.3. Experimental Design
The experimental design is shown in Table 1, the experimental data were analysed using RSM to fit the second order polynomial equation created by Design-Expert 7 software (Stat-Ease Inc., USA) The parameters were selected for the studies as follows: reaction temperature (60-90°C), ZnCl2. 4H2O/ Urea molar ratio (50- 90% w/w) and time (60-120 min). The variable ranges are shown in Table 1. The ranges were selected to keep the intervals within mild reaction conditions. Table 1 describes the five coded levels (−α, −1, 0, 1, α) and un-coded independent factors, the test ranges for the parameters and the overall experimental design. The CCD design made up of 20 experiments (8 factorial points, 6 centre points and 6 axial point) were carried out with three variables and each variable varied at three levels to allow for the evaluation of the curvature [24]. The value of α is the distance from the axial points to the central point α= (2n) 1/4, in which n is the number of independent factors, for three factors α=1.68 [25]. The factorial design experiments were run in duplicates to ensure reliability; the average error was calculated and used.
| Independent Variable | Symbols | Unit | Code Levels | ||||
|---|---|---|---|---|---|---|---|
| - | - | - | -1.68 (-α) | -1 | 0 | 1 | 1.68 (+α) |
| Time | A | min | 39.55 | 60 | 90 | 120 | 140.45 |
| Temperature | B | ᵒC | 49.77 | 60 | 75 | 90 | 100.23 |
| Solvent concentration | C | % | 36.36 | 50 | 70 | 90 | 103.64 |
2.4. Model Formulation and Statistical Analysis
The experimental data was used to develop a quadratic polynomial model having % cellulose recovery (Y1), % hemicellulose recovery in the liquid fraction (Y2) and % lignin recovery (Y3). The general regression model (Eq. (1)) was adopted.
 |
(1) |
Where A, B, C represent the symbols of the independent variables, temperature, time and solvent concentration, respectively. α0; α1, α2 and α3 are the regression coefficients for the linear terms of the expression and α11, α22, α33α12, α13 and α23 are the regression coefficients for the quadric terms of the equation. All experiments were done in duplicate and average values were calculated and used in the development of the model. The statistical analysis, plotting of the response surfaces and the optimization were performed using “Design Expert” software (Trial version 7.0.3, Stat-Ease, Inc., Minneapolis, USA). The fit quality of the polynomial equation was assessed by the coefficient of determination (R2), the significance of the regression and statistical coefficient was checked using t-test and F-test, respectively. The predictability of the developed model was then cross validated using laboratory experiments.
2.5. Desirability Function
Numerical optimization by desirability function was carried out to optimize the operating conditions of the pretreatment. The desirability function technique can be used to determine the optimum conditions of a process which involves one or more responses. The desirability procedure first determines the independent variable levels that simultaneously produce the most desirable prediction for the responses, thereafter the overall desirability of the outcome is maximised based on the factors which can be controlled.
In numerical optimization, the desired goal for each factor and response was chosen. The goals defined were as follows: maximise, minimise, target, exact value (for factors only), none (for responses only) and within range. Maximum and minimum levels for each factor were chosen. The factors can also be weighted according to priority. The goals were combined to get a desirability function. The desirability function is an objective value ranging from zero (outside the goal) and one representing the goal, the program thus aims at maximising this function. The goal seeking step starts randomly from one point and makes its way to a maximal point through the steepest slope.
3. RESULTS AND DISCUSSION
3.1. Central Composite Design Studies
CCD was employed using the Design-Expert (Stat-Ease, Inc., Minneapolis, USA) software to study the simultaneous effects of reaction time, temperature and solvent concentration of pretreatment on cellulose recovery, hemicellulose recovery in the liquid fraction and lignin recovery. The experimental conditions were obtained by a complete three-factor experimental design, which included six replications of the centre point and six axial points and eight factorial points. Table 2 shows the series of conditions of the experiments conducted for each run.
3.2. Composition of Solid Fraction
The detailed recovery of the components of ZnCl2.4H2O/ Urea treated solid fraction for each run are shown in Table 2. The highest solids recoveries of cellulose for the pre-treatment were obtained in run 10 (39.55 min, 75 oC, 70/30% (w/w) ZnCl2.4H2O /urea) and 12 (90 min, 49.77 oC, 70/30% (w/w) ZnCl2.4H2O /Urea) with 87.6% and 86.1%, respectively. This shows that cellulose is not less affected by the severity of the pretreatment as opposed to hemicellulose. Hemicellulose recoveries were lowest at run 8 (120 min, 90°C, 90/10% (w/w) ZnCl2.4H2O/Urea) and for run 4 (90 min, 49.11 °C, 70/30% (w/w) ZnCl2.4H2O /Urea). These severities are considered high due to longer times and higher temperatures. This is in agreement with the various studies which state that hemicellulose is more susceptible to pretreatment conditions [26]. Additionally, the lowest lignin recovery for the trials were obtained during run 3 (60 min, 75, 50%), 4 (60 min, 100.23°C, 70/30% (w/w) ZnCl2.4H2O /Urea) 8 (120 min, 90°C, 90/10% (w/w) ZnCl2.4H2O /Urea).
3.3. Models and Statistical Analysis
The experimental data was analysed using the Design-Expert software and a second-order polynomial equation was obtained. The equation included linear, quadratic and interactive terms for the variables tested. The polynomial equations, describing the cellulose recovery (Y1), hemicellulose recovery (Y2) and lignin recovery (Y3) as a function of reaction time (A), temperature (B) and solvent concentration (C) of ZnCl2.4H2O/ Urea MHS pretreatment are shown in Eq. (2), Eq. (3) and Eq. (4):
 |
(2) |
 |
(3) |
 |
(4) |
| Run | Variable | - | Response | ||||
|---|---|---|---|---|---|---|---|
| - | A: Time (min) | B: Temperature (°C) | C: Concentration (%) | Y1: Cellulose Recovery (%) |
Y2: Hemicellulose Recovery (%) |
Y3: Lignin Recovery (%) |
|
| 1 | 60 | 60 | 50 | 57.487 | 15.220 | 45.903 | |
| 2 | 120 | 60 | 50 | 74.779 | 16.727 | 48.612 | |
| 3 | 60 | 75 | 50 | 88.874 | 17.418 | 63.182 | |
| 4 | 90 | 100.23 | 70 | 95.097 | 21.928 | 63.532 | |
| 5 | 60 | 60 | 90 | 80.921 | 10.150 | 44.640 | |
| 6 | 120 | 60 | 90 | 83.765 | 19.137 | 50.701 | |
| 7 | 60 | 75 | 90 | 100.220 | 15.265 | 62.986 | |
| 8 | 120 | 90 | 90 | 88.359 | 29.473 | 63.112 | |
| 9 | 39.55 | 75 | 70 | 73.056 | 12.741 | 49.193 | |
| 10 | 140.45 | 75 | 70 | 99.030 | 19.682 | 56.694 | |
| 11 | 90 | 49.77 | 70 | 64.434 | 9.5438 | 43.350 | |
| 12 | 90 | 100.23 | 70 | 96.729 | 19.459 | 56.409 | |
| 13 | 90 | 75 | 36.36 | 71.993 | 14.009 | 49.943 | |
| 14 | 90 | 75 | 103.64 | 94.561 | 20.753 | 55.441 | |
| 15 | 90 | 75 | 70 | 80.192 | 14.728 | 49.319 | |
| 16 | 90 | 75 | 70 | 78.353 | 16.903 | 50.018 | |
| 17 | 90 | 75 | 70 | 81.149 | 20.438 | 52.334 | |
| 18 | 90 | 75 | 70 | 84.803 | 16.269 | 48.437 | |
| 19 | 90 | 75 | 70 | 86.734 | 13.168 | 51.740 | |
| 20 | 90 | 75 | 70 | 87.210 | 15.220 | 51.597 | |
| Source | Sum of Squares | Degree of Freedom | Mean Squares | F-values |
p-value Prob > F |
|---|---|---|---|---|---|
| Model | 1934.95 | 9 | 214.99 | 10.23 | 0.0006 |
| A | 71.26 | 1 | 71.26 | 3.39 | 0.0953 |
| B | 34.03 | 1 | 34.03 | 1.62 | 0.2319 |
| C | 62.64 | 1 | 62.64 | 2.98 | 0.1149 |
| AB | 2.26 | 1 | 2.26 | 0.11 | 0.7495 |
| AC | 49.57 | 1 | 49.57 | 2.36 | 0.1555 |
| BC | 316.45 | 1 | 316.45 | 15.06 | 0.0031 |
| A2 | 10.84 | 1 | 10.84 | 0.52 | 0.4889 |
| B2 | 18.75 | 1 | 18.75 | 0.89 | 0.3671 |
| C2 | 0.14 | 1 | 0.14 | 6.547E-003 | 0.9371 |
| Residual | 210.10 | 10 | 21.01 | - | - |
| Lack of Fit | 140.97 | 4 | 35.24 | 3.06 | 0.1073 |
| Pure error | 69.13 | 6 | 11.52 | - | - |
| Total | 2145.05 | 19 | - | - | - |
| Source | Sum of Squares | Degree of Freedom | Mean Squares | F-values |
p-value Prob > F |
|---|---|---|---|---|---|
| Model | 326.75 | 9 | 36.31 | 6.45 | 0.0037 |
| A | 27.84 | 1 | 27.84 | 4.95 | 0.0503 |
| B | 16.96 | 1 | 16.96 | 3.01 | 0.1132 |
| C | 15.20 | 1 | 15.20 | 2.70 | 0.1313 |
| AB | 1.04 | 1 | 1.04 | 0.18 | 0.6768 |
| AC | 44.91 | 1 | 44.91 | 7.98 | 0.0180 |
| BC | 15.42 | 1 | 15.42 | 2.74 | 0.1288 |
| A2 | 1.28 | 1 | 1.28 | 0.23 | 0.6438 |
| B2 | 0.045 | 1 | 0.045 | 7.919E-003 | 0.9308 |
| C2 | 7.18 | 1 | 7.18 | 1.28 | 0.2851 |
| Residual | 56.27 | 10 | 5.63 | - | - |
| Lack of Fit | 22.48 | 4 | 5.62 | 1.00 | 0.4761 |
| Pure error | 33.79 | 6 | 5.63 | - | - |
| Total | 383.02 | 19 | - | - | - |
| Source | Sum of Squares | Degree of Freedom | Mean Squares | F-values | p-value Prob > F |
|---|---|---|---|---|---|
| Model | 674.73 | 9 | 74.97 | 9.18 | 0.0009 |
| A | 19.38 | 1 | 19.38 | 2.37 | 0.0504 |
| B | 157.40 | 1 | 157.40 | 19.27 | 0.0014 |
| C | 16.11 | 1 | 16.11 | 1.97 | 0.1905 |
| AB | 30.88 | 1 | 30.88 | 3.78 | 0.0805 |
| AC | 15.90 | 1 | 15.90 | 1.95 | 0.1932 |
| BC | 6.75 | 1 | 6.75 | 0.83 | 0.3847 |
| A2 | 20.94 | 1 | 20.94 | 2.56 | 0.1404 |
| B2 | 4.17 | 1 | 4.17 | 0.51 | 0.4912 |
| C2 | 18.00 | 1 | 18.00 | 2.20 | 0.1685 |
| Residual | 81.67 | 10 | 8.17 | - | - |
| Lack of Fit | 44.35 | 4 | 11.09 | 1.78 | 0.2508 |
| Pure error | 37.32 | 6 | 6.22 | - | - |
| Total | 756.41 | 19 | - | - | - |
Eqs. (2 - 4) are predictive regression models that could be used to explain the main effect of the individual variables and as well as the interactive effect on the responses considered. Furthermore, it could be explained that the negativity of the regression coefficients indicates (as a rule of thumb) the negative effect of the factors on the responses (decrease the response). For example, solvent concentration (C) decreases cellulose recovery (Y1). Whereas the positivity of the regression coefficients indicates (as a rule of thumb) the positive effect of the factors on the responses (enhancement in the quantity of the response).
3.3.1. Analysis of Variance
The significance of the developed model, the pretreatment variable (linear and quadratic) as well as the interaction effects were analysed using one-way Analysis of Variance (ANOVA). ANOVA is a tool used to test the statistical significance of each variable by comparing the estimated experimental error to the mean square [27]. The p-value showed that some terms where significant while others were not. However, all the coefficients were considered in the design and polynomial equation to minimise the error. The results of ANOVA for cellulose recovery, hemicellulose recovery in the liquid fraction and lignin recovery after ZnCl2.4H2O/Urea pretreatment are presented in Tables 3, 4 and 5 respectively.
The model analysis gave F-value of 10.23, 6.45 and 9.18 for cellulose recovery, hemicellulose recovery in the liquid fraction and lignin recovery respectively. This implies that the models are significant for each of the responses. The F-value of the model is calculated as the ratio of mean square values for individual terms to the mean square values for the residuals. The Prob > F represents the probability of the F-statistics value. This is used as a test for the null hypothesis. For a model to be considered significant, the p-value needs to be lower than 0.05, this value indicates that there is only a 5% chance that the models the values represent could occur due to noise [27]. The models of cellulose recovery, hemicellulose recovery in the liquid fraction and lignin recovery are significant and effectively describe the responses. The cellulose recovery response model has a lower p-value (0.0006) than the hemicellulose recovery in the liquid fraction model (0.0037) and lignin recovery model (0.0009) indicating that the model for cellulose recovery is most significant.
| Response | Standard Deviation | Mean | C.V.% | PRESS | Adeq-precision |
|---|---|---|---|---|---|
| Cellulose recovery (%) | 4.58 | 82.39 | 5.56 | 1460.56 | 12.91 |
| Hemicellulose recovery (%) | 2.37 | 16.91 | 14.03 | 300.85 | 11.59 |
| Lignin recovery (%) | 2.86 | 52.86 | 5.41 | 497.61 | 9.67 |
In Table 3, A (Time) and BC (Temperature * solvent concentration) are significant model terms in the model Eq. (2) and they significantly affect cellulose recovery, while the other coefficients do not influence cellulose recovery greatly in the range of this study. The results are in accordance with the observation that cellulose dissolution only takes place under harsh conditions such as high temperatures [28]. A (Time) and AC (Time * solvent concentration) as seen in Table 4 also have significant effects on model Eq. (3), they therefore significantly affect hemicellulose recovery in the liquid fraction while the other factors do not. The solvent concentration influence is second order however there has been evidence showing the cellulose solvent (NaOH) concentrations having an impact on Hemicellulose dissolution [29]. For lignin dissolution, the coefficients which are significant in the model are A (Time) and B (Temperature). This is in agreement with Vancov and McIntosh (2011) who noted that in the case of delignification, even in mild alkaline solvent conditions, an increase in the temperature improves the delignification rate [30].
The “Lack of Fit F-value” of 3.06, 1.00 and 1.78 for cellulose recovery, hemicellulose recovery in the liquid fraction and lignin recovery respectively, implies the lack of fit is not significant when in relation to the pure error. The “Lack of Fit F value” is not significant and there is only a 10.73% (Table 3), 47% (Table 4) and 25% (Table 5) chance that the large values of F could have occurred as a result of noise.
3.3.2. Model Summary
Table 6 shows the model summary for each response. The Coefficient of Variability (C.V) measures residual variations of the data in relation to the size of the mean. Higher C.V values usually indicate lower reliability while relatively low values of C.V indicate better reliability and precision of the conducted experiments. The C.V% was a low value of 5.56%, 14.03% and 5.41% for cellulose recovery, hemicellulose recovery in the liquid fraction and lignin recovery respectively which indicates that the experiments conducted were reliable and precise. The value of the signal-to-noise ratio (adequate precision ratio) was found to be 12.919, 11.593 and 9.672 indicating the models have an adequate signal. The adequate precision ratio and adjusted determination coefficient (Adj R2) exceeded 4 and 0.70, respectively for all three models. This indicates that a good correlation between input and output variables could be drawn by the model developed and it was implied that the quadratic model could be used to explore the design space, predict the responses and find the optimal conditions of this process.
3.3.3. Pareto Analysis
The percentage effect of each of the factors was done by the Pareto analysis [16]. The analysis calculates the percentage effect (Pi) of each factor on the response, according to the following equation:
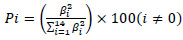 |
(5) |
Where βi is the regression coefficient of each process variable.
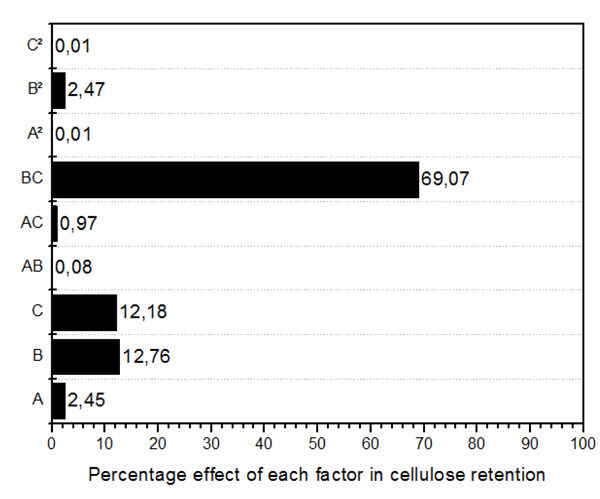
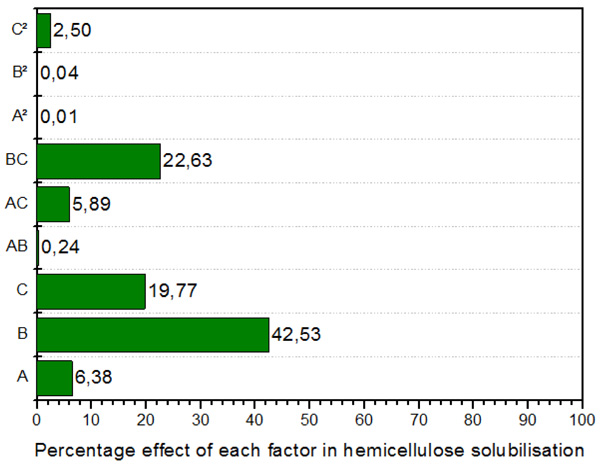
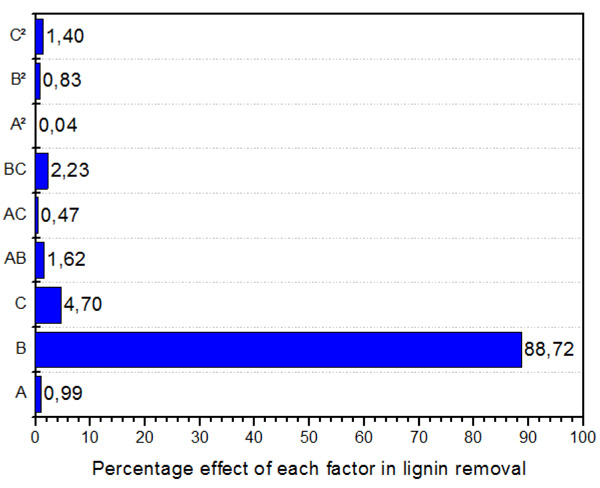
Figs. (1, 2 and 3) shows the Pareto plot. As seen in Fig. (1) under the ZnCl2.4H2O/ Urea pretreatment, the most significant factor in cellulose recovery are B (Temperature) and C (Solvent concentration) in both linear and interactive forms. The interactive form (AB) however has the highest influence of 69.07%. Hemicellulose recovery in the liquid fraction was mainly affected by temperature (linear term), followed by interactive term (BC), solvent concentration (linear term), time (linear term) and interaction of time and temperature. Finally, lignin recovery was affected primarily and almost entirely by temperature (linear term) with 88.72% effect. Followed by solvent concentration (linear term) at 4.7%. The highest interactive term was temperature*solvent concentration (BC) with 2.2% effect on lignin recovery.
3.3.4. Model Fitting
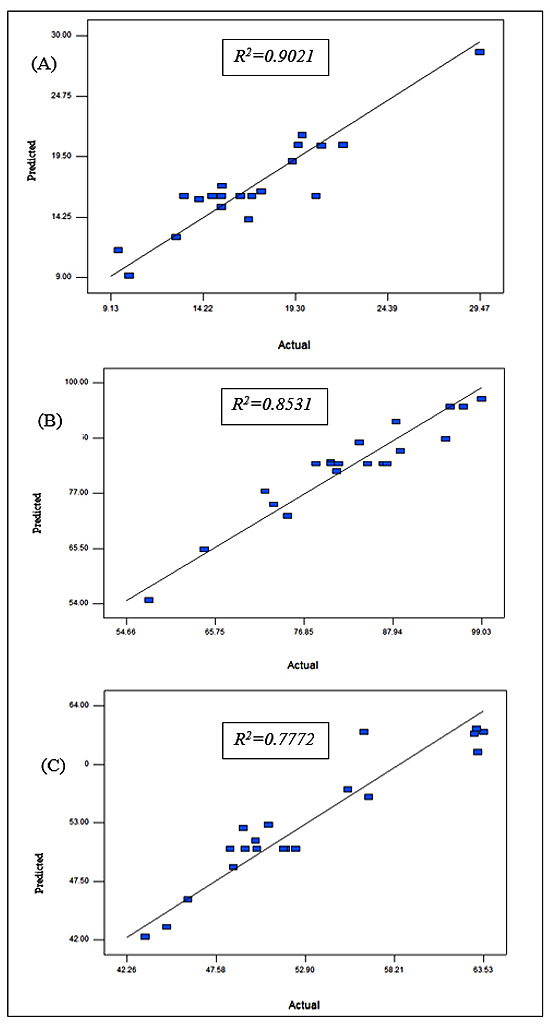
The reliability of the predicted models was additionally tested by comparing the predicted and experimental response results. The observed recovery from the experiment and the predicted values are shown and represented as a parity plot in Fig. (4) with the R2 values for each response. In each case, there was satisfactory correlation between the predicted values and observed values from the experiment which was R2=0.9021, 0.8531, 0.8920 for Figs. (4A, 4B and 4C), respectively. The values indicate close agreement between the experimental and predicted values for each response. In Figs. (4A, 4B, 4C), 9.8%, 14.69% and 22.3% of the total variation, respectively, was not explained by the model.
3.4. Influence of Pretreatment Parameters Combinations
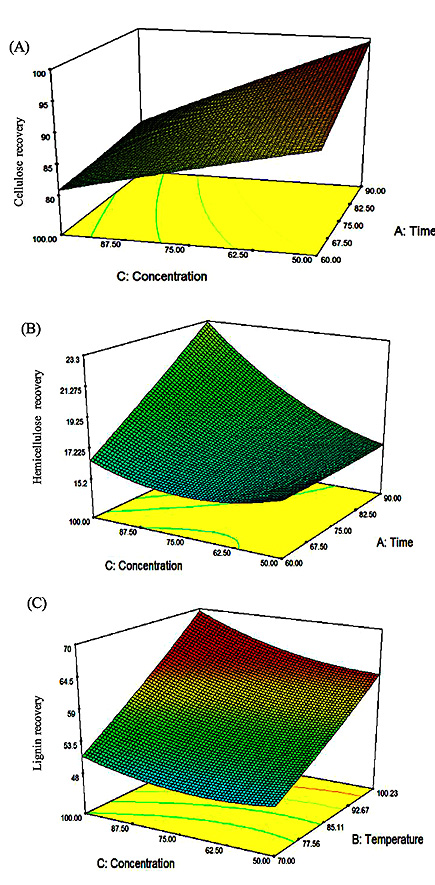
The three-dimensional response surface plot described by the above-mentioned polynomial Eq. (2), Eq. (3) and Eq. (4) were fitted to the experimental data as represented in Fig. (4). One of the variables was kept constant (at midpoint) while the other two variables were varied according to the experimental ranges determined previously. The shapes of the response surfaces indicate the type and amount of the interaction between the different independent variables [31]. The surface plots for the cellulose, hemicellulose and lignin recovery are shown in Fig. (5A, 5B and 5C). Fig. (5A) shows that the pretreatment temperature had the major increasing effect on cellulose recovery. As seen in Fig. (5A), longer times result in higher cellulose recovery only for the pretreatment at higher temperatures while the effect of longer pretreatment time was negligible at lower pretreatment temperatures. At higher solvent concentrations, cellulose recovery increased, however, as the concentration increased, the effects of increasing temperature became negligible after 77 oC. Overall, the cellulose recovery was maximum at 100.23% with only a small increase when time is increased to approximately 90 min.
The response surface plots for the hemicellulose recovery in the liquid fraction are shown in Fig. (5B). The results showed that temperature also has a large influence on hemicellulose recovery in the liquid fraction. Fig. (5B) shows a decrease in the recovery of hemicellulose in the liquid fraction with increasing concentration until 75% where an increase is observed thereafter. The largest recovery in the liquid fraction is observed at higher concentration and longer time. In Fig. (5B), it was observed that at lower concentrations, the effect of temperature is negligible. While at lower temperatures, the effect of concentration is negligible. However, at higher temperatures and concentrations, we notice an increase in the hemicellulose recovery in the liquid fraction. As expected, the recovery of hemicellulose is highly dependent on the severity of the experiment. This is in agreement with various other studies which have shown a dependence of hemicellulose on severity compared to the other components [32]. The graph of the interaction between concentration and temperature (Fig. 5B) gives the maximum recovery of 24.6% at 100% concentration, 100.23 oC and time at the midpoint of 75 minutes; these are the best conditions for achieving high yields of recovered hemicellulose in the liquid fraction. This validates the results of the Pareto chart in Fig. (2) where Temperature* Solvent concentration (BC) had the highest interactive influence on the response.
Fig. (5C) represents the effects of temperature and time on lignin recovery at a constant solvent concentration of 75%. An increase in temperature resulted in a linear increase in lignin recovery. The length of time had no influence on the lignin recovery at lower temperatures; however, the lignin recovery was maximal at shorter times. Results in Fig. (5C) shows that an increase in time caused a linear decrease in lignin recovery at low solvent concentrations, however at higher solvent concentrations; there is a slight decrease in lignin recovery with increasing time. Solvent concentration at shorter times resulted in a decrease in lignin recovery until approximately 62.50% thereafter, an increase in lignin recovery was observed. Fig. (5C) shows the effect of temperature and concentration on lignin recovery at a constant time of 75 min. Solvent concentration has a negligible effect on the recovery of lignin at lower temperatures. There is however a slight increase in lignin recovery with increasing concentration. Temperature has a linear effect on lignin recovery as the increase in temperature results in an increase in the response at both high and low solvent concentrations. Figure 4.8C shows the highest amount of recovery (69%) and this agrees with the Pareto chart (Fig. 3) where BC is shown to have the highest interactive effect on lignin recovery
3.5. Optimization by Desirability Function
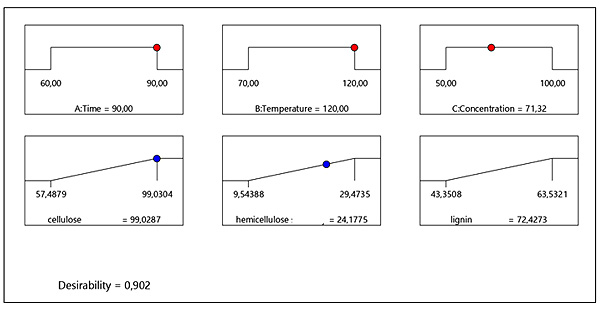
The mathematical model which was developed from the experimental data can be used for the effective prediction of the operating conditions which should be used for the optimization of the model responses. The strategy that was used can determine the pretreatment temperature, pretreatment time and solvent concentration, which leads to maximum responses. Desirability Function (DF) assigns a scale-free value to all responses in the problem by the so-called individual desirability functions and then combine these values by usually taking their geometric mean to obtain an overall desirability function as a single objective [27]. This multiple response numerical method was applied for the optimization of any combination of three factors (time, temperature, concentration). Fig. (6) was obtained from design expert analysis and demonstrates the desirability values of the numerical optimization procedure in which the criteria were set as follows: “in range” for time (60 min), “in range” for temperature (70-120°C), “in range” for concentration (50-90%) the objective was to optimize (maximize) the responses, cellulose recovery, hemicellulose recovery in the liquid fraction and lignin recovery to analyse economically viable optimal conditions. A variety of solutions were found however the best local maximum was shown as a desirability plot (Fig. 6). The desirability plot shown in Fig. (6), provides the optimized treatment conditions of 90 min, 120°C and concentration of 71.32% (w/w) ZnCl2. 4H2O/ Urea. At this condition, cellulose recovery was 99.03%, hemicellulose recovery in the liquid fraction was 27.18% and lignin recovery was 72.43% and desirability was 0.902. These optimum values were cross validated experimentally which resulted in 91% cellulose recovery, 29% hemicellulose recovery in the liquid fraction and 68% lignin recovery at the same conditions. These values indicate the suitability and accuracy of the model. Apparently, the recovery of cellulose needs different conditions compared to hemicellulose recovery in liquid fraction and lignin recovery. These were the best conditions to favourably optimize all three responses.
The optimized value for the solvent concentration is 71.32% (w/w) ZnCl2.4H2O/ Urea. This low solvent concentration is advantageous as it reduces the viscosity of the solvent. This reduces some challenges, which are usually encountered with higher concentrations of MHS. The optimized temperature of 120°C is higher than the glass transition temperature of both lignin and hemicellulose, which are 40°C and from 50°C – 100°C, respectively. This temperature is thus expected to delignify the biomass as well as increase the dissolution of hemicellulose to an extent [33]. The pretreatment time of 90 min is desirable as it is expected to reduce the degradation of the polysaccharide components (cellulose and hemicellulose) which results in an increase in polysaccharide yield and decrease in fermentation inhibitors. The obtained desirable conditions differ largely from those obtained in the pretreatment of wheat straw using ionic liquid pretreatment. The conditions found in the study performed by Fu and Mazza were 158°C, 49.5% ionic liquid concentration and 216 min [34]. The large difference in the optimal conditions is caused by the responses for the optimization being based on the recovery of fermentable sugars in the pretreatment of wheat straw as opposed to whole fractions of the components as calculated in this study [34].
CONCLUSION
The effect of dissolution parameters (solvent concentration, reaction time and temperature) on the pretreatment efficiency. Appropriate predictive empirical linear models were developed for each response (cellulose recovery, hemicellulose recovery in the liquid fraction and lignin recovery). The effects of the individual variables and their interactions were found to be statistically significant. The results showed that the quadratic terms among the investigated variables were statistically insignificant. Time was shown to influence all the responses while the temperature * solvent concentration interaction and time * solvent concentration interaction were shown to influence cellulose recovery and hemicellulose recovery, respectively. Optimization resulted in 91% cellulose recovery, 29% hemicellulose recovery in the liquid fraction and 68% lignin recovery at mild conditions of 90 minutes, 120°C and 71%/29% (w/w) ZnCl2.4H2O/ Urea. This study demonstrates optimization of a mild lignocellulosic biomass pretreatment method that enables the production of value-added products from cellulose, hemicelluloses and lignin.
CONSENT FOR PUBLICATION
Not applicable
AVAILABILITY OF DATA AND MATERIALS
The data supporting the findings of the article is available in the Wits University Institutional Repository at http://wiredspace.wits.ac.za/.
FUNDING
The authors are grateful to the National Research Foundation, South Africa and the University of the Witwatersrand, South Africa for financial support of this study. MOD is particularly grateful to NRF, South Africa for the research grant, 118549, that supported this research.
CONFLICT OF INTEREST
The authors declare no conflict of interest, financial or otherwise.
ACKNOWLEDGEMENTS
Declared none.