All published articles of this journal are available on ScienceDirect.
Production of Citric Acid from the Fermentation of Pineapple Waste by Aspergillus niger
Abstract
Background:
Citric acid, aside its uses as a cleaning agent, has varied applications in the chemical, pharmaceutical, and food industries. A biotechnological fermentation process is one of the easiest ways to satisfy the demands for this useful commodity.
Methods:
The fermentation of pineapple waste by Aspergillus niger for the production of citric acid was investigated in this study. STATISTICA 8 release 7 (Statsoft, Inc. USA) statistical software was used for the design of experiments, evaluation, and optimization of the process using the central composite design (CCD), a response surface methodology approach. Lower-upper limits of the design for the operating parameters were temperature (25-35 oC), fermentation time (35-96 h), pH (3-6), methanol concentration (1-7%) and glucose (15-85 g/L). Twenty-seven duplicated experimental runs were generated for the CCD route.
Results & Conclusion:
The optimal operating conditions were validated at 38 g/L of glucose concentration, 3% (v/v) of methanol, 50 h of fermentation time, pH of 4.3 and temperature of 30 oC which yielded15.51 g/L citric acid. The statistical significance of the model was evaluated using a one-way analysis of variance. The validated predicted response values obtained from the statistical model showed close relationships with the experimental data.
1. INTRODUCTION
Citric acid with the formula C6H8O7 is a weak organic acid. It consists of 3 carboxyl (R-COOH) groups [1]. A lot of organic effluents in the form of pomace, seeds, and peels are produced as wastes from the fruit juice industry [2]. Due to the wide use of citric acid, different types of fungi have been used in its production since 1917 and yeasts have also been used since 1960 [3]. Most importantly, citric acid has been produced industrially in more recent years by fungal fermentation of glucose or sucrose mainly by Aspergillus niger, using various raw materials as substrates. Some raw materials that are readily available and inexpensive previously used as substrates include: corn-cobs, rapeseed oil, carob pod extract, kiwi-fruit peel, mandarin orange, grape and apple pomace, and brewery wastes. A. niger has however remained the most preferred organism due to a number of factors: the capacity of utilizing cheaper raw materials, genetic stability, high yield of product and absence of undesirable reactions [4, 5].
With a world production of above 18 million tonnes as at 2009, pineapple ranks 12th amongst fruit crops around the world [6]. Nigeria ranked 6th on the list for world pineapple production with nearly 800,000 tonnes produced annually [7, 8]. However, pineapple waste is commonly dumped on landfills resulting in environmental pollution [9]. Utilization of fruits and vegetable effluent provides an economically feasible method of producing citric acid [10]. Furthermore, since pineapple is a perennial plant, there is a steady supply of raw materials, which in turn reduces the costs of citric acid production [10]. Pineapple waste which is agro-industrial based waste also has roles to play in evolving bio-commodities production [11, 12]. With the need to meet increasing citric acid demands, and overcoming the present challenges of pollution, industrialists need to optimize, especially the process variables (conditions) of the citric acid production, due to their impact on the process economy [3]. The global demand for citric acid is increasing at an unprecedented rate due to its diverse application (preservative, antioxidant, pH-regulator, acidulant, etc.) [2, 13-16]. Therefore, there is a need to develop strategies that will optimize its process yields. Several physicochemical parameters and nutritional requirements which favour the biotechnological production of citric acid have previously been reported in the literature [17-19]. These nutritional requirements include the inoculum size, substrate concentration, temperature, pH, etc. [17-19]. Looking critically at how the operating parameters interact and affect the citric acid production process is very crucial. These process variables during the fermentative citric acid production are not well understood in the literature. Mathematical and statistical-based methods such as Response Surface Methodology (RSM) could help in understanding the main and the interactive effects during citric acid production, thereby enhancing the production process yields. RSM has been used in understanding the parametric effects on various bioprocesses such as the production of yoghurt [20-22].
There are several published studies using different synthetic routes and different starting materials for the production of citric acid [23]. It was reported that chemical methods are not as economical compared to the fermentation process. In the chemical processing route, the starting materials are worth more than the final product [23, 24]. Industrial production of citric acid by fermentation using cheap raw materials like pineapple waste will be helpful in economic development.
Design of experiment (DOE) methodology which is a robust technique for process optimization [2] was accurately used in this study. The effect of the various operating variables (glucose concentration, effects pH, temperature, methanol concentration, fermentation time) on citric acid production were adequately evaluated. This study optimizes the result via the CCD approach with the development of a regression model to explain the influence of the variables on the yield of citric acid. The low-high levels of the operating parameters of temperature, time, pH, methanol concentration, and glucose concentration for the experimental design were chosen based on the optimum validated conditions obtained in our earlier studies where apple pomace and corn steep liquor were used as the feed-stocks [2]. The study also demonstrated the feasibility of pineapple waste (a cheap raw material) as a potential substrate for the manufacture of citric acid.
| - | Temperature | Time | pH | Methanol | Glucose | Observed citric | Predicted citric | Residuals |
|---|---|---|---|---|---|---|---|---|
| Run order | oC | h | conc (g/L) | conc (g/L) | acid yield (g/L) | acid yield (g/L) | (g/L) | |
| 1 | 25 | 10 | 5 | 24 | 3 | 12.33 | 12.30 | 0.03 |
| 2 | 30 | 40 | 6 | 60 | 4 | 11.77 | 11.73 | 0.04 |
| 3 | 30 | 40 | 3 | 60 | 7 | 12.20 | 11.77 | 0.43 |
| 4 | 30 | 110 | 3 | 60 | 4 | 10.36 | 10.19 | 0.17 |
| 5 | 30 | 30 | 3 | 60 | 4 | 10.28 | 10.21 | 0.07 |
| 6 | 40 | 40 | 3 | 60 | 4 | 13.18 | 11.91 | 1.27 |
| 7 | 25 | 80 | 2 | 96 | 6 | 12.97 | 12.71 | 0.26 |
| 8 | 25 | 10 | 2 | 96 | 3 | 13.28 | 13.50 | -0.22 |
| 9 | 25 | 10 | 2 | 24 | 6 | 10.31 | 10.40 | -0.10 |
| 10 | 35 | 80 | 5 | 96 | 6 | 10.23 | 9.73 | 0.50 |
| 11 | 25 | 80 | 5 | 24 | 6 | 12.38 | 12.31 | 0.07 |
| 12 | 30 | 40 | 0 | 60 | 4 | 12.10 | 12.12 | -0.02 |
| 13 | 35 | 80 | 2 | 24 | 6 | 11.20 | 11.35 | -0.15 |
| 14 | 25 | 80 | 2 | 24 | 3 | 14.29 | 14.05 | 0.25 |
| 15 | 30 | 40 | 3 | 60 | 1 | 12.66 | 12.42 | 0.24 |
| 16 | 35 | 10 | 2 | 24 | 3 | 11.69 | 11.77 | -0.08 |
| 17 | 30 | 40 | 3 | 72 | 4 | 15.51 | 15.54 | -0.03 |
| 18 | 35 | 80 | 2 | 96 | 3 | 12.74 | 12.87 | -0.13 |
| 19 | 25 | 10 | 5 | 96 | 6 | 10.08 | 11.74 | -1.67 |
| 20 | 20 | 40 | 3 | 60 | 4 | 10.26 | 10.55 | -0.29 |
| 21 | 35 | 10 | 5 | 96 | 3 | 10.36 | 10.12 | 0.24 |
| 22 | 30 | 40 | 3 | 12 | 4 | 11.13 | 10.87 | 0.26 |
| 23 | 35 | 10 | 2 | 96 | 6 | 10.92 | 11.11 | -0.18 |
| 24 | 30 | 40 | 3 | 60 | 4 | 10.46 | 11.08 | -0.62 |
| 25 | 25 | 80 | 5 | 96 | 3 | 10.33 | 10.44 | -0.11 |
| 26 | 35 | 10 | 5 | 24 | 6 | 13.02 | 13.06 | -0.04 |
| 27 | 35 | 80 | 5 | 24 | 3 | 10.49 | 10.67 | -0.18 |
2. MATERIALS AND METHODS
2.1. Raw Materials
The wild type of Aspergillus niger was obtained from the Biology Laboratory, Department of Biological Sciences, Covenant University, Ota Nigeria. Pineapples wastes were collected from the Cafeteria of Covenant University, Ota, Nigeria.
2.2. Procedure and Pretreatment
Pineapple peels were air dried for about 8 hours and further dried in a convention oven for 2 h at 60 °C and then screened to fractional sizes. Screened particle sizes of 2 mm were used for this study. The spore suspension used for the A. niger was 0.5% of the standard McFarland solution (a chemical solution of 1%BaCl2 (0.05 mL) and 1%H2SO4 (9.95 mL) to a bacterial suspension of 1.5 x 10⁸/mL. The turbidity of the McFarland solution was compared to the bacterial suspension. Process variables studied were glucose concentration, pH, temperature, methanol concentration and fermentation time. Based on these selected variables, CCD of the STATISTICA software generated 27 different experimental runs (Table 1). The pH was adjusted using 0.1 N HCl or 0.1 N NaOH as the case may be.
2.3. Fermentation Process
The fermentation process involved the initial preparation of media, inoculation, and incubation for the specified period as stated in the experimental design. The amount of citric acid produced was determined titrimetrically.
The inoculation of the fermentation media was prepared by mixing 1.5 g substrate in 250 ml Erlenmeyer flasks with the volume raised to 50 mL with distilled water. The whole mass was autoclaved for 15 min at 121 °C prior to the fermentation process. Thereafter, it was cooled to room temperature. A. niger was used to inoculate each medium with the addition of methanol (0–5%) to the flasks. During the fermentation, the operational set point parameters were kept as specified in the design. The fermentation process of the inoculum media was conducted in duplicate in an orbital incubator at 180 revolutions per minute at specified operational temperature.
2.4. Citric Acid Determination
In order to determine the citric acid produced after fermentation, 0.1 M NaOH was titrated against the extract (juice) using phenolphthalein as an indicator [25]. The equivalent number of moles of NaOH required to neutralize citric acid, C3H5O (COOH)3, the content of the pineapple juice was determined based on the concentration and volume of NaOH solution used during titration (Eq. (1)).
| Moles NaOH required = vol of NaOH required (mL) x concentration of NaOH (moles/L) x 10-3 | (1) |
The amount in moles of citric acid, C3H5O (COOH)3, in the titrated sample was determined according to Equation(2):
 |
(2) |
The concentration (molarity) of citric acid produced was calculated by Eq. (3)
 |
(3) |
The concentration of C3H5O (COOH)3 in g/L was determined by Eq. (4) and (5)
 |
(4) |
| Concentration in g/L= Concentration in mol/L × Molar mass (g/mol) | (5) |
2.5. Model Development
The experimental data as presented (Table 1 ) were used to generate a second-degree polynomial model (Eq. (6)) that relates citric acid response to the five operational parameters considered in this study.
 |
(6) |
Where Y is the yield of citric acid generated, αo to α45 are the model coefficients, A, B, C, D and E are linear coefficients, A2, B2, C2, D2, and E2 are quadratic coefficients while AB, AC, AD, AE, BC, BE, CD, CE and DE represent the interactions between individual parameters on citric acid production. The model coefficients were obtained using the least square estimation method and the most suitable model was selected based on the mean square error (MSE) value. The accuracy of the model fitness was evaluated by the analysis of variance (ANOVA).
3. RESULTS AND DISCUSSION
3.1. Interaction of Parameters on Citric Acid Response
The results of the experiments are presented in Table 1. The highest yield of citric acid (15. 51 g/L) was observed in experimental run 17 at the prevailing conditions of 30 oC, 40 h, pH of 5, methanol concentration of 72 g/L and glucose concentration of 4 g/L. Looking closely,the citric acid yield was much lower compared to our previous study [2]. In the study [2], better yields of citric acid (with the maximum value of 59.00 g/L) were obtained when the carbon sources were apple pomace and corn steep liquor and at very reduced methanol concentration, reduced pH of 4.5, and temperature of 38 oC. These highlight the sensitivity of the operating variables in the citric acid fermentation process which conform to previous studies [26, 27]. Sugar or carbon sources utilization and citric acid yields appear to be a closely related. The more the carbon source is utilized, the more the citric acid yield.
3.2. Model Development for Citric Acid Production Optimization
The regression model which explains the influence of the operating variables on citric acid produced is presented in Equation 7. The model statistical significance was evaluated using the analysis of variance (ANOVA). ANOVA together with tools like R2, the sum of squares values, and the P (probability) values validate the model results. R2 value close to unity means that the reliability of the model is very high. A very high F-value and low P (probability) value indicate the validity of operating parameters on the dependent variable (citric acid yield). The statistical validation further shows how individual, quadratic, and interactive factors (independent variables) are significant on citric acid yield. In other words, statistical validation reveals which of the operating parameters will actually greatly influence the production of citric acid from pineapple waste. The model generated for the effective prediction of citric acid production from pineapple waste using Aspergillus niger is given as follows:
 |
(7) |
Where citric acid yield (Y) is the dependent variable; A(temperature), B(fermentation time), C(pH), D(methanol concentration) and E(glucose concentration) are the independent parameters investigated on citric acid yield.
Furthermore, from the ANOVA (Table 2), the sum of squares (SS) values indicate minimal variability in the data set. SS is the square of the difference between the individual measurements and the mean of all measurements. It measures the amount of data variability and how far the individual measurements are from the mean. A high SS would indicate a lot of variability in the data.
3.3. Effect of Operating Variables on Citric Acid Production
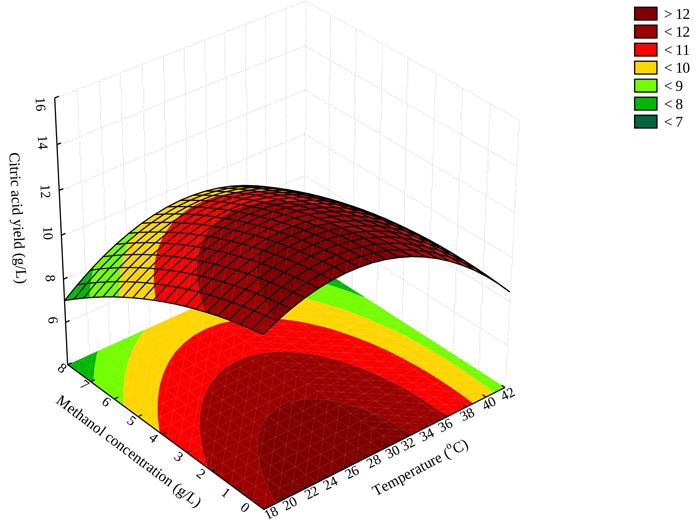
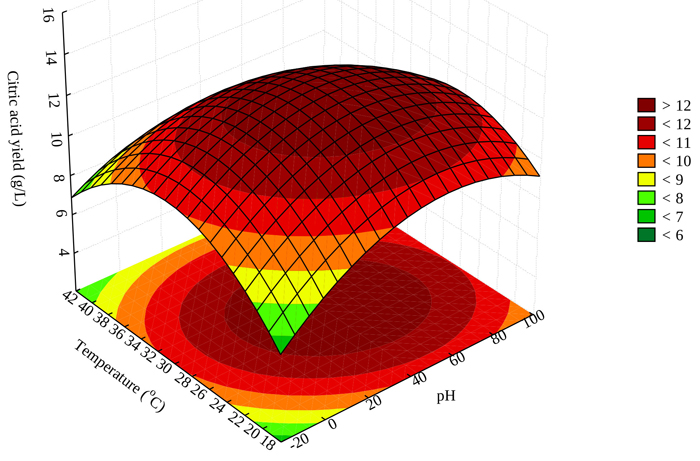
Maximum production of citric acid through the process of fermentation by Aspergillus niger is rested on the availability of sufficient carbon sources [28, 29]. Many other factors such as temperature, pH, and methanol concentration have been reported to also have different effects on the yield of citric acid [13]. The type and concentration of sugar have effects on citric acid production [23]. There should be minimum and maximum levels of sugar dosages in order to maximize citric acid production. High-level sugar in medium introduces intracellular compounds, may cause mycelium overgrowth which increases viscosity in the medium causing reduction in citric acid production [30]. For media having less than 2.5%, minimal level of citric acid production is achieved [23]. In understanding the interactive effects of experimental factors on citric acid yield in this study, response surface and contour plots (Figs. 1 to 4) were utilized. Understanding the interactions of the operating parameters and conditions with citric acid production through the help of the surface and contour plots guide the decisions to be made in predicting the ranges of citric acid optimization.
3.4. Effect of Methanol Concentration and Temperature on Citric Acid Yield
Fig. (1) illustrates the interaction between temperature and methanol concentration and citric acid yield. The response surface plot shows that maximum citric acid production should be achieved at low methanol concentrations (not greater than 3 g/L) and temperature ranges between 20–30 oC (Fig. 1). The results obtained in this study are consistent with the literature, mesophilic temperatures (25-35 °C) have been reported as favorable for optimum yield of citric acid [31].
3.5. Effect of Fermentation Time and pH on Citric Acid Production
A high pH often results in the deactivation of the enzyme necessary for citric acid production. During fermentation, the pH of the medium is important because a low pH reduces the risk of contamination of the fermentation process [13]. A low pH of the fermentation medium inhibits and removes unwanted organic acids (oxalic acid and gluconic acid) thereby increasing the production of citric acid [23]. In addition, glucose oxidase may be activated reducing citric acid production [32]. Increasing pH beyond 4.5 during the production process reduces the final yield of citric acid [23]. It should be noted that the type of carbon substrate for the fermentation process also contribute to either increasing or decreasing the pH of the medium [2]. Fig. (2) shows that increasing the time for fermentation increases the pH of the medium. Though it appears from the response plot that more of the citric acid was produced, the optimum production points cannot be achieved in relation to other parameters as temperature, methanol concentration, and glucose loading. Looking closely in Fig. (2), the optimum conditions should be located between pH 3-5 and fermentation time ranges of 4-8 h.
3.6. Effect of Temperature and pH on Citric Acid Production
Temperature and pH of fermentation medium are essential parts for maximizing the production of citric acid by Aspergillus niger. Fig. (3) shows that maximum production of citric acid can be achieved for pH range 2.0-6.0 and a temperature range of 24-38 oC. Maximum production of 15.51 g/L citric acid was achieved at a pH of 3 and 30 oC fermentation temperature (Table 1). This guided our judgement for the optimization process. Increased citric acid production may be attributed to high enzymatic activity at increasing temperatures. This agrees with other relevant studies as reported in the literature [33].
| Factor | Sum of squares (SS) | Degree of Freedom | Mean square | F-value | P-value | Interpretation |
|---|---|---|---|---|---|---|
| A | 5.50 | 1 | 5.50 | 5.68 | 0.0545 | Significant |
| A2 | 4.02 | 1 | 4.02 | 4.15 | 0.0877 | Marginally significant |
| B | 11.13 | 1 | 11.14 | 11.49 | 0.0147 | Significant |
| B2 | 1.14 | 1 | 1.17 | 1.18 | 0.3196 | – |
| C | 6.47 | 1 | 6.47 | 6.68 | 0.0414 | Significant |
| C2 | 2.26 | 1 | 2.26 | 2.33 | 0.1772 | – |
| D | 8.27 | 1 | 8.27 | 8.53 | 0.0266 | Significant |
| D2 | 0.39 | 1 | 0.39 | 0.40 | 0.5488 | – |
| E | 0.07 | 1 | 0.07 | 0.07 | 0.8013 | – |
| E2 | 4.17 | 1 | 4.17 | 4.30 | 0.0833 | Marginally significant |
| AB | 0.49 | 1 | 0.49 | 0.51 | 0.5031 | – |
| AC | 4.36 | 1 | 4.37 | 4.51 | 0.0779 | Marginally significant |
| AD | 0.39 | 1 | 0.39 | 0.41 | 0.5444 | – |
| AE | 2.13 | 1 | 2.14 | 2.21 | 0.1878 | – |
| BC | 2.03 | 1 | 2.03 | 2.09 | 0.1974 | – |
| BD | 3.69 | 1 | 3.69 | 3.82 | 0.0986 | Marginally significant |
| BE | 2.08 | 1 | 2.08 | 2.15 | 0.1929 | – |
| CD | 0.65 | 1 | 0.65 | 0.68 | 0.4410 | – |
| CE | 0.59 | 1 | 0.59 | 0.61 | 0.4629 | – |
| DE | 0.17 | 1 | 0.17 | 0.17 | 0.6864 | – |
| Error | 5.8139 | 6 | 0.9690 | – | – | – |
| Total SS | 53.0265 | 26 | – | – | – | – |


3.7. Effect of Temperature and Fermentation Time on Citric Acid Production
The interactive effect of fermentation time and temperature on citric acid yield is as shown in Fig. (4). A shorter production time is of great importance. This reduces the cost of production.
3.8. Optimization and Validation of the Operating Conditions
Eq. (7) was solved by the method of Myers and Montgomery [34] to obtain the optimum parameters required for the generation of citric acid. The surface responses, as well as the ANOVA results, were used to predict the optimum conditions of citric acid generated. Responses predicted for citric acid production were evaluated using Eq. (7). These results showed that methanol concentration above 2% (v/v) is suitable for citric acid production. The ANOVA analysis of the methanol concentration factor provided a low probability value of 0.0266 on the linear term (Table 2). Table 2 shows the analysis of the developed model using ANOVA.
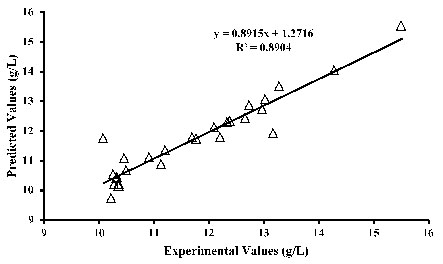
Furthermore, Table 2 shows that the linear effects of the temperature, time, pH, and methanol concentration to be significant on citric acid production. The quadratic terms of temperature, glucose concentration, the interactive effect of temperature-time, and the interactive effect of time and methanol concentration are marginally significant on citric acid production. These evaluations follow the trends as shown through the response surface plots (Figs. 1 to 4). From the regression model (Eq. 7), the coefficient of determination (R2) of 0.895 was obtained by comparing the experimental with the predicted values.
This indicates that 89.5% of the observed data can be demonstrated by the model while only 10.5% cannot be accounted for by the model. ANOVA shows a developed model to be marginally significant with a probability value of 0.060. The observed (experimental) and predicted values were compared and noted to be in close agreements (Fig. 5), further validating the model. The differences between the experimental and predicted values, that is, the residuals (Table 1), were also within the allowable ranges. Predicted optimum conditions for citric acid production were 41 g/L glucose concentration, 5.5%(v/v) methanol, 45 h fermentation time, pH of 5.4, and temperature of 34 oC given a yield of 13.5 g/L citric acid.
Optimal conditions were validated by carrying out another duplicated set of an experiment which gave the optimum conditions as 38 g/L of glucose concentration, 3% (v/v) of methanol, 50 h of fermentation time, pH of 4.3 and temperature of 30 oC which yielded 15.51 g/L citric acid.


CONCLUSION
The optimal operating conditions were determined at 38 g/L of glucose concentration, 3% (v/v) of methanol, fermentation time of 50 h, pH 4.3 and temperature of 30oC. It can be noted that pineapple waste (a low-cost substrate) is a possible substrate that can be used for citric acid production. However, low yields of citric acid were produced under the prevailing conditions in this study. Future studies will focus on improving the operating conditions such as using different carbon sources like sucrose or fructose instead of glucose in order to maximize citric acid production. The production process highlighted in this work is a possible solution to alleviate the negative impacts on the environment caused by the disposal of pineapple waste.
CONSENT FOR PUBLICATION
Not applicable.
AVAILABILITY OF DATA AND MATERIALS
Not applicable.
FUNDING
None
CONFLICT OF INTEREST
The authors declare no conflict of interest, financial or otherwise.
ACKNOWLEDGEMENTS
The authors are grateful to the management of Covenant University, Ota, Nigeria for sponsoring the publication of this article.


