All published articles of this journal are available on ScienceDirect.
Current and Future Global Lithium Production Till 2025
Abstract
Background:
The production of lithium is growing continuously, and ensuring its stable supply is crucial for the growth of global economy. Therefore, to avoid a potential supply risk, it is necessary to determine the requirements for the implementation of current and planned lithium mining projects in order to meet the forecasted demand of lithium.
Objective:
In this paper, the capability of global lithium production to meet the uncertain, high or low level, demand by 2025, is analyzed.
Methods:
The global lithium supply is simulated considering three alternatives: no new projects in the portfolio, committed projects, and uncommitted projects. Two scenarios for estimating the growth rate of lithium production in the future are analyzed: a regular growth rate and a growth rate assuming the use in full capacity of lithium production by major suppliers.
Results:
The results show that the total capacity of production covers the low-level demand. However, it is not enough to cover the high-level demand for lithium. Therefore, new projects are necessary. On the other hand, results considering all the possible projects show that the demand is exceeded, which suggests that intermediate scenarios could cover the demand by 100%.
Conclusion:
It is expected that a low-carbon economy may be projected soon, and assuming the high-level demand of lithium, then a combination of committed projects and uncommitted projects should be considered.
1. INTRODUCTION
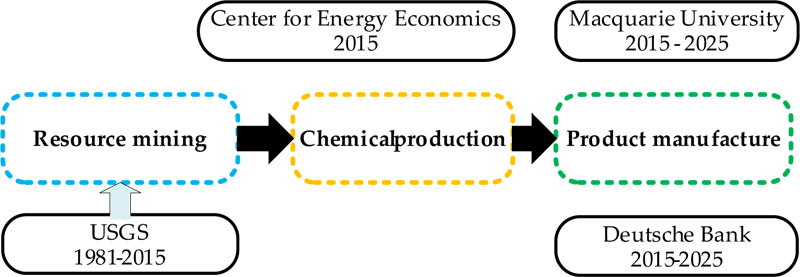
In recent years, concerns about critical materials have been increasing [1]. The criticality of a given material is evaluated with the level of supply risk and the impact that this potential risk would have on the whole system in a determined timeframe [2]. These supply risks would have a significant impact on the operation of companies and the maintenance of the current standards of societies. Lithium is considered a critical material because it plays an essential role in the development of a low-carbon economy [3]. However, lithium compounds are also used in systems, such as military, communication, and especially in the production of several industrial applications, such as ceramics and glasses, lubricants and greases, pharmaceutical products, and aluminum products, among others [4]. A general scheme of the lithium processing stages is shown in Fig. (1), and each stage is described in more detail below.

In the resource mining stage, there are three types of lithium sources - brines, ores, and clays. However, most of the lithium resources are obtained from brines and ores deposits [6]. According to the United States Geological Survey (USGS) report in 2017, the total lithium resources are 53 million tones, and the total reserves are 16 million tonnes [7]. The resources are defined as the naturally occurring solid, liquid, or gaseous material on the earth’s crust, and reserves are commodities that could be economically extracted or produced [8]. The most important sources of brines are in Chile, Argentina, and Bolivia; whereas, the ores deposits are mainly located in Australia and China. It is also possible to find lithium deposits in Europe and other countries, such as Brazil, Canada, Portugal, the US, and Zimbabwe. However, these deposits only represent roughly 3.5% of the resources worldwide [4].
The chemical production stage represents the production of lithium compounds and their derivatives from the sources mentioned above. The most common lithium compounds are lithium carbonate, lithium hydroxide, and lithium chloride [5], [9]. Besides, lithium concentrate plays a fundamental role in this stage. There are two types of lithium concentrate – the technical-grade concentrate and the chemical-grade concentrate. The technical-grade lithium concentrate is mainly used for the manufacturing of glasses and ceramics, whereas the chemical-grade lithium concentrate is used in chemical plants to produce lithium compounds [10]. Lithium derivatives are considered as chemical products fabricated from lithium compounds [11]. The main lithium derivatives are butyl lithium and lithium metal. It is worth mentioning that in the world, there are only four countries that ensure more than 90% of global chemical production: Chile, Australia, Argentina, and China [12].
In the product manufacturing stage, lithium compounds and derivatives, as well as lithium concentrate, are used to make a wide range of goods. The main applications of lithium worldwide are – lithium-ion batteries, ceramics and glasses, lubricants and greases, continuous casting molds powders, refrigerants, polymers, and aluminum alloys [4]. Currently, lithium-ion batteries are the main application of lithium, whereas ceramics and glasses are the second ones, sharing respectively 35% and 32% of the global lithium market [4]. There are also some goods with a low share in the global lithium market, e.g., pharmaceuticals, cement additives, organic synthesis products, flavor and fragrances, dyes and pigments, organic intermediates, as well as catalysts and fireworks [4, 13].
Because lithium cannot be substituted in most applications, therefore, its supply risks are influenced by demand increase. 8–11% annual growth of lithium demand is anticipated [4]. For example, lithium use in the battery industry increased from zero to 80% of the market share between 1991 and 2012. The leading consumer of lithium is China, with 35% of the total world consumption, followed by Europe, Japan, the Republic of Korea, and North America with 24%, 12%, 10%, and 9% of the world consumption, respectively [14]. Furthermore, the demand for lithium will have a significant increase in the forthcoming years, mainly due to the fast-increasing demand for lithium-ion batteries [12-14]. Consequently, in the coming years, this phenomenon will result in several challenges to the suppliers. Hence, the determination of the capacity of each supplier is of primordial importance to evaluate if it will be possible to supply the increasing demand in the coming future [15].
The production of lithium has continuously grown [16]. However, as the demand is dynamically increasing, it does not mean that the future supply would be satisfied [4]. Therefore, to avoid a potential supply risk, it is important to determine the requirements for the implementation of current and planned lithium mining projects to satisfy the forecasted demand of lithium. The main objective of this paper is to evaluate the capability of suppliers to meet the lithium demand by the output of the current mining projects, as well as committed and uncommitted ones. The research is focused on the assessment of the production capacity of the top lithium suppliers - Chile, China, Australia, and Argentina.
2. METHODOLOGY
The methodology used in this article is based on three steps: data collection, system dynamics modeling, and scenario building. The data collection is performed to determine the global lithium supply from 1981 to 2015 and the estimated lithium demand in the years 2015 to 2025. The system dynamics model is designed to analyze the dynamic behavior of stocks and flows in the supply chain of lithium. Scenario building is used to estimate the lithium supply between 2015 and 2025 considering different growth rates in the production capacity of the world suppliers. A detailed description of each step of the methodology is presented below.
2.1. Data Collection
The collected data covers the period from 1981 to 2025 (Appendix, Table A1. The data is mainly from institutional reports, as shown in Fig. (2). In the resource mining stage, the historical data for the countries producing lithium are obtained from USGS for years 1981-2015 [17-39]. In the chemical production stage, the report of the Center for Energy and Economics provides information corresponding to the conversion from the resource mining stage to the product manufacturing stage in 2015 [40]. In the product manufacturing stage, two databases are used to show the estimated demand for lithium quantitatively until 2025; reports are provided by Macquarie University and Deutsche Bank [41].
The estimation of Deutsche Bank considers that the increase in battery demand is a driving force of the future rising demand for lithium. This report assumes that in the future, mobility will be based on electric vehicles; hence, the demand for lithium will increase proportionally to the demand for those means of transportation. Deutsche Bank estimates that the share of electric vehicles in the global lithium market demand will be more than 50% in 2025. When considering fuel efficiency versus CO2 regulations in the U.S. and Europe, the fundamental assumption made by Deutsche Bank for the assessment of battery demand is the statement that electric vehicles should reach cost parity with internal combustion cars by the early 2020s and with power diesel trains within the next five years. Therefore, the Deutsche Bank estimation of required lithium in the future is considered as high-level demand in this study. Deutsche Bank data include the application of lithium in electric vehicles, energy storage, traditional batteries, e-bikes, glass and ceramics, greases, air treatment, polymers, medicaments, primary batteries, aluminum, and casting powders.
On the other hand, the estimation of demand by Macquarie University indicates that the main driver of lithium demand is electric vehicle penetration in the global market as well as some other factors. Macquarie University assumes that increasing passenger vehicle battery size and steady growth in electric bus and truck production in China are also key factors. Their estimation is based on the growth of the companies that will produce these vehicles, specifically Tesla and China vehicle manufacturers. They consider that lithium has the most significant growth among mined commodities, but still, their estimations are below the Deutsche Bank assessment. Therefore, in this article, Macquarie University’s estimation of required lithium in the future is considered as low-level demand. The applications considered in this study are hybrid and plug-in electric cars, energy storage systems, two wheels’ electric vehicles, ceramic and glass, lubricant greases, air conditioning, polymers, medicaments, other batteries, aluminum, and continuous casting.
2.2. System Dynamics Model
The system dynamics method is used in this study for two reasons. First, we need to quantify the changes in time of various lithium streams, from mining to manufacturing. Second, we need to analyze the potential capacity of main national suppliers to meet the lithium demand in the specified timeframe [42, 43].
All variables and parameters nomenclature are given in Appendix, Table A1. Based on the system dynamics method, we developed a stock and flow model of the lithium flows. The model consists of three major segments, as shown in Fig. (1). The segments are marked by three colors: blue - resource mining stage, yellow - chemical production, green - product manufacturing as shown in Fig. (3). In the first stage, resource mining, the production in Chile, Argentina, Australia, China, Canada, Brazil, Portugal, Zimbabwe, Namibia, Russia, and the United States, is taken into account. In the second stage, chemical production corresponds to the processes of making butyl lithium, lithium metal, lithium chloride, lithium carbonate, lithium hydroxide, and lithium concentrate. Finally, the third stage includes products containing lithium, such as polymers, batteries, air treatment equipment, aluminum alloys, metal casting powders, ceramics and glasses, lubricant greases and others.
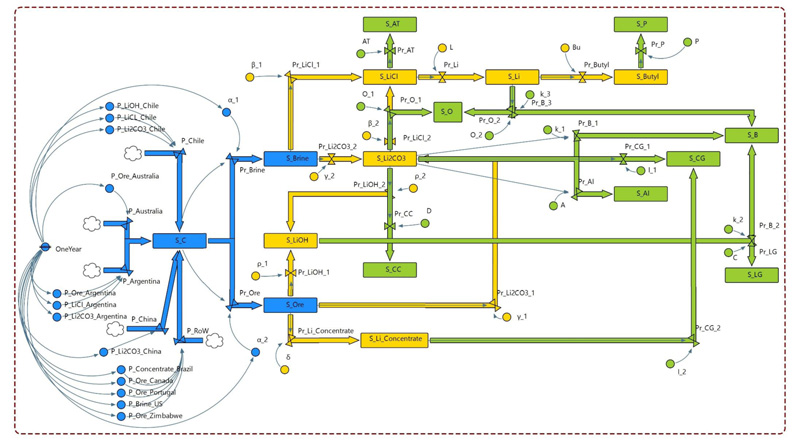
It is important to note that every variable in the system dynamics model is calculated at each time step. For example, in this simulation, we consider the time step equal to one year as the input data are based on yearly reports. As explained in the previous section, data are collected for years 1981 -2025. The dynamic behavior of the lithium processing stages is simulated by a set of mathematical equations, which is provided in detail in Appendix, Table A1.
The stock equation is given by Forrester [43] as:
 |
(1) |
Where, t0 is the initial year and t is the final year considered; Stock(t) is a mass accumulated in the system at the time t of the period 1980-2025 due to influx Inflow(t) and loss Outflow(t).
 |
(2) |
Where, V(t) is an auxiliary variable in time t. For example, in the lithium model, the brine process as flow depends on the amount of extracted brine and the stock of the global supply of lithium. P represents input parameters, such as the concentration of production and coefficient of processing (all input parameters are given in Appendix, Tables A2, A3).
The initial flows of the model occur in the mining stage. For example, the mathematical representation of the global supply of lithium SG(t) is given as follows:
 |
(3) |
Where the primary production of lithium by Chile (PChile(t)), Australia (PAustralia(t)), Argentina (PArgentina(t)), China (PChina(t)) and other countries including Brazil, Canada, Portugal, the US, and Zimbabwe (PRest of World(t)) is considered. Two processes including brine processing (PrBrine(t)) and ore processing (PrOre(t)) are assumed as the main chemical processes in this step. SG(tO) is the initial stock of the global supply of lithium.
2.3. Scenario Building
This study focuses on the production capacity of the top lithium suppliers (Chile, Australia, Argentina, and China) as these suppliers affect the system considerably. One of the main criteria for estimating the future lithium supply is the analysis of different types of projects that will increase global lithium production. The lithium production projects could be classified as no New Project (NP), Committed Projects (CP), and Uncommitted Projects (UCP). The projects from CP and UCP are considered from the Canaccord report [13].
Two scenarios for the future growth rate of lithium production have been considered: regular growth rate (Reg scenario) and full capacity growth rate (FC scenario). Both are related to the increase in capacity. The regular growth scenario considers the increase in production until now, and will continue with the same annual growth rate, based on historical data. In this case, the capacity depends on the production growth rate. The full capacity growth scenario expects that the capacity of production of each country will reach 100% in 2025, unlike the previous scenario, in which the production growth rate depends on the production capacity.
These scenarios are proposed to analyze the ratio of lithium supply and demand in three phases of its processing: mining, chemical production, product manufacturing.
The scenarios are based on the Compound Annual Growth Rate (CAGR) to assess the current and future production of lithium. Results are compared with the low and high level of future lithium demand until 2025.
In literature, the CAGR measure has been used to quantify the growth of the demand for electric vehicles [44]. Equation 4 represents the equation of CAGR [45], in which the variables used are the lithium production amount in two different years as the initial value Piv and final value Pfv; N is the period (years) between those two produced amounts.
 |
(4) |
In scenario Reg, CAGR is calculated for each country for the ten-year period 2005-2015. In 2015, none of the countries has been using 100% of its production capacity. The CAGR calculated for the period 2005-2015 is used to estimate the supply for 2015-2025. This estimation is given by Equation 5 [45].
 |
(5) |
Where, the future lithium production value is P'fv; initial lithium production value is P'iv; CAGR is the compound annual growth rate; N is the given period (years).
In scenario FC, CAGR depends on the maximum capacity of production of each country. In this scenario, the calculated CAGR assumes that all countries will reach 100% production capacity. After deriving the CAGR, the estimation of production is determined year by year. Since not all countries have the same lithium production growth year by year, the CAGR is calculated for each country separately, and next, an estimation for each country is completed. The estimation of the global lithium supply is given by the summation of lithium production in all countries.
| Country | Capacity of Production in 2015 (%) |
|---|---|
| Argentina | 51 |
| Australia | 65 |
| Chile | 62 |
| China | 20 |
The production capacity is an essential part of the analyzed scenarios. Table 1 shows the percentage of the maximum production capacity used by each country in 2015, according to the Canaccord report [13].
3. RESULTS AND DISCUSSION
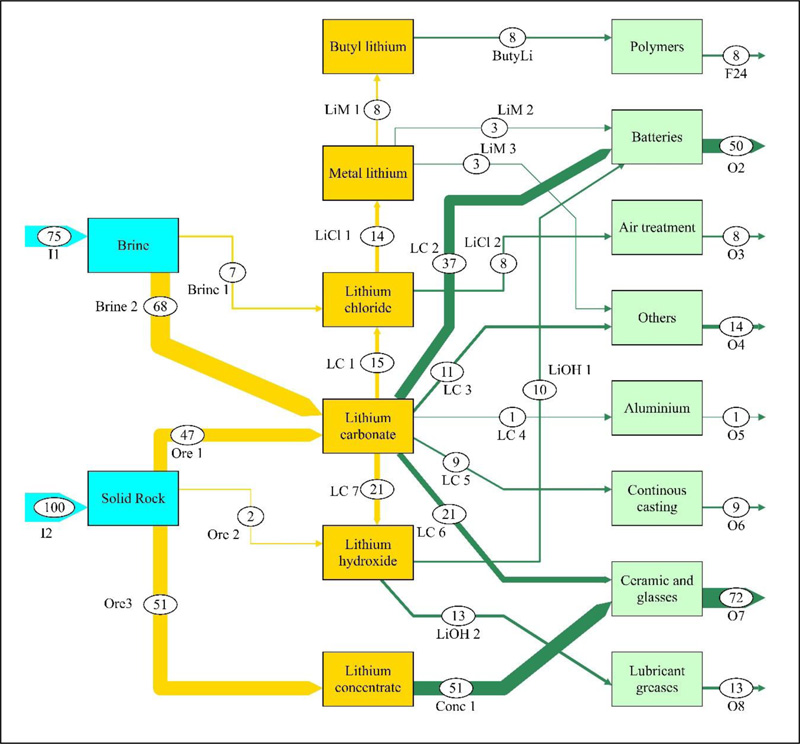
According to the databases used in this study, as shown in Fig. (1), the flows between resource mining, chemical production, and product manufacture are calculated as material flow. We present in Fig. (4) the material flow between lithium processing stages using the production data of the major producers in 2015, according to the report of the Center of Energy Economics [46].
In Fig. (4), the quantity of material at each flow is proportional to the thickness of the arrow. The largest arrows in the figure are the flows of lithium brine and lithium concentrate from the resource mining stage to the chemical production stage, as well as the flows of lithium carbonate and lithium concentrate from chemical production to product manufacturing stage. All the lithium flows shown in Fig. (4) are measured in thousands of tonnes.
The diagram in Fig. (4) supports the finding of the Center of Energy Economics database, which points out that the essential elements in the chemical production stage are carbonate and concentrate as well as the most important elements in the product manufacturing stage are batteries, ceramic and glasses.
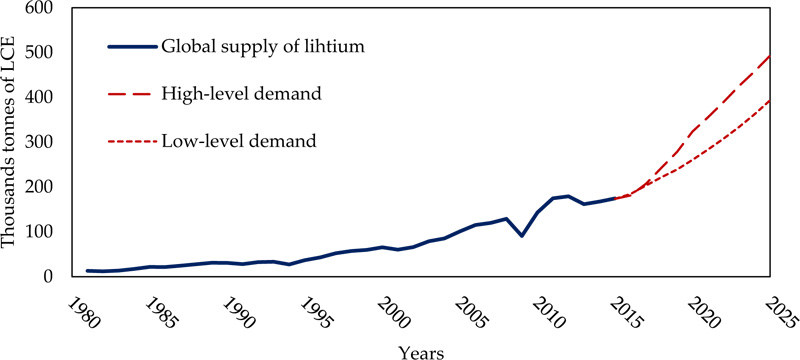
Considering the USGS database and the reports of Macquarie University and Deutsche Bank, Fig. (5) presents the historical global supply of lithium as well as the low and high-level demand for it. The high-level demand will reach around 493 thousand tonnes of LCE by 2025 with a CAGR of 11%, whereas the low-level demand for lithium will reach ca. 393 thousand tonnes of LCE by 2025 with a CAGR of 9%.
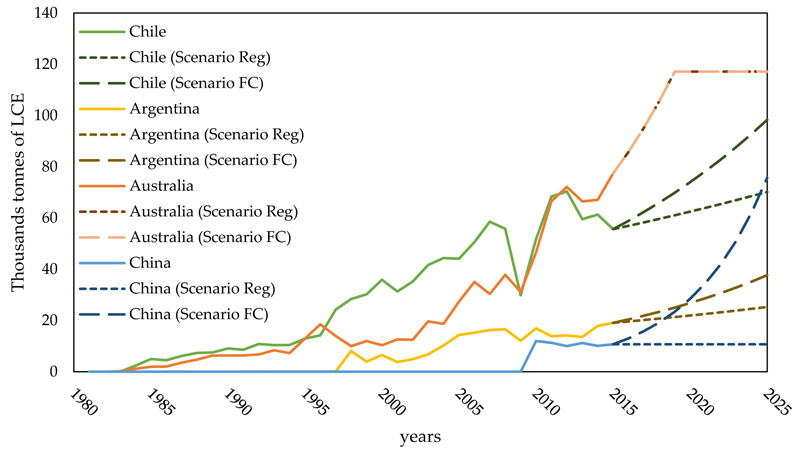
Table 2 gives the calculated CAGR for the regular growth rate for each country and the percentage of capacity achieved in 2025. The calculated CAGR of Chile and Argentina are similar. Australia has a high CAGR, which allows for significant growth until 2025. Australia will probably stop its production growth in 2019 as it will reach 100% of its production capacity. In the case of China, its CAGR from 2005 to 2015 is zero. It shows that China does not have any growth in its lithium production.
To achieve 100% capacity until 2025, the CAGR of each country shall be calculated depending on how close they are to the 100% capacity. The countries with higher capacity are Argentina, Australia, and Chile, with 51, 65 and 62% respectively. China has 20% of capacity. This means that the CAGR needed for Argentina, Australia, and Chile is less than the CAGR needed by China due to the difference in the 100% capacity desired. Table 3 shows CAGR calculated for each country at 100% of their lithium production capacity in 2025.
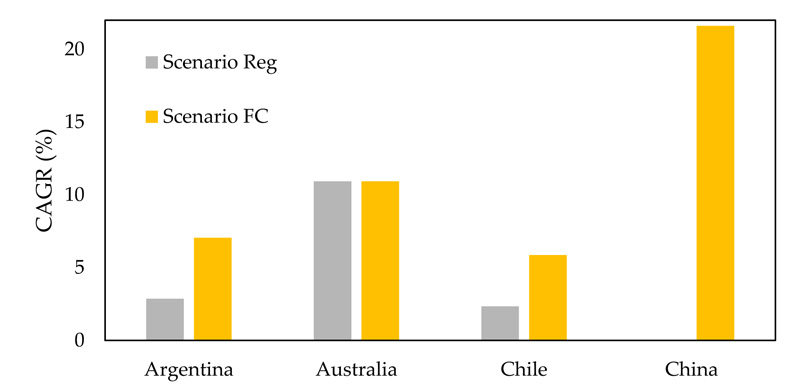
The CAGR comparison of Reg scenario and FC scenario is presented in Fig. (6). Australia presents the same CAGR calculated in both scenarios because with its regular growth, Australia shall reach a 100% capacity. Argentina needs to increase its CAGR 3 times and Chile needs to increase its CAGR 2.3 times to reach a 100% capacity. In the case of China, they have no capacity in Reg scenario and need a 22% increase for the FC scenario. This is due to the low capacity that China has (Table 1), and this percentage represents that China does not extract the reserves of lithium that they possess, but they import lithium brine and concentrate to convert into other compounds of the lithium supply chain. As Xin Sun mentions, the flow of minerals from China is low but the flow of basic chemicals from China is much bigger [5].
Fig. (7) presents the historical global lithium production for each country until 2015. Then, the data is calculated with the model using the CAGR of Tables 2 and 3. In 2019, a continuous line shown at 118000 tonnes of LCE produced from Australia represents the 100% capacity of Australia. It has been mentioned that Australia would reach a 100% capacity in both scenarios according to the CAGR that they have historically. The rest of the countries may reach 100% capacity until 2025.
| Country | CAGR (Scenario Reg) | Capacity of Lithium Supply | |
|---|---|---|---|
| 2005-2015 (%) | 2015 (%) | 2025 (%) | |
| Argentina | 3 | 51 | 67 |
| Australia | 11 | 65 | 100 |
| Chile | 2 | 62 | 71 |
| China | 0 | 20 | 20 |
| Country | CAGR (Scenario FC) | Capacity of Lithium Supply | |
|---|---|---|---|
| (%) | 2015 (%) | 2025 (%) | |
| Argentina | 7 | 51 | 100 |
| Australia | 11 | 65 | 100 |
| Chile | 6 | 62 | 100 |
| China | 22 | 20 | 100 |
In the scenario building section, three scenarios are mentioned; NP, CP, and UCP. Each one of them is described in the next paragraphs.
Fig. (8) shows the results of a comparison between supply and demand for NP scenarios. The low level-demand can be met in 2025 with the FC scenario but not with the Reg scenario. The Reg scenario reaches around 354 thousand tonnes of LCE covering 90% of the low-level demand. The high-level demand is not covered by any of the NP scenarios; Reg scenario reaches 72% of the high-level demand and FC scenario reaches 83% of the high-level demand, respectively. These results indicate that even with a full capacity production, the demand still overpasses the possible supply, and therefore, new projects are required.
Fig. (9) presents the dynamics of the global supply and demand for lithium, according to the Committed Projects (CP) scenarios. The result shows that low-level demand is overpassed by Reg scenario and FC scenario. However, none of the scenarios reach high-level demand. Reg scenario covers 84% of the high-level demand and FC scenario covers 95% of high-level demand. These results indicate that with the committed projects, only the low-level demand is covered. As there is a possibility for the high-level demand to occur, it poses a risk on the supply of lithium with CP scenarios.
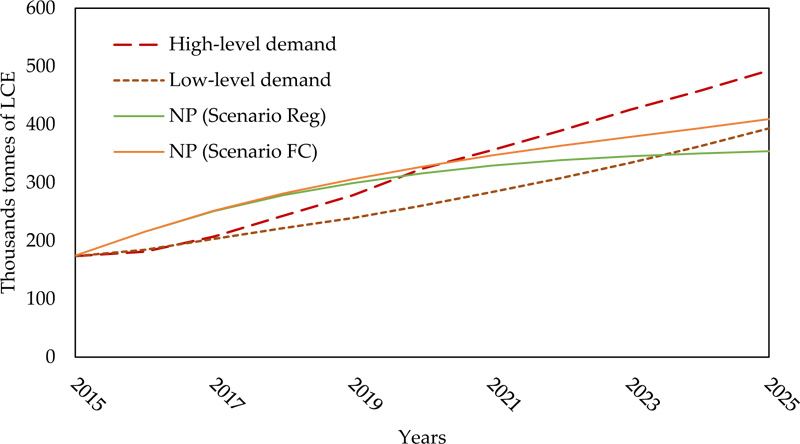
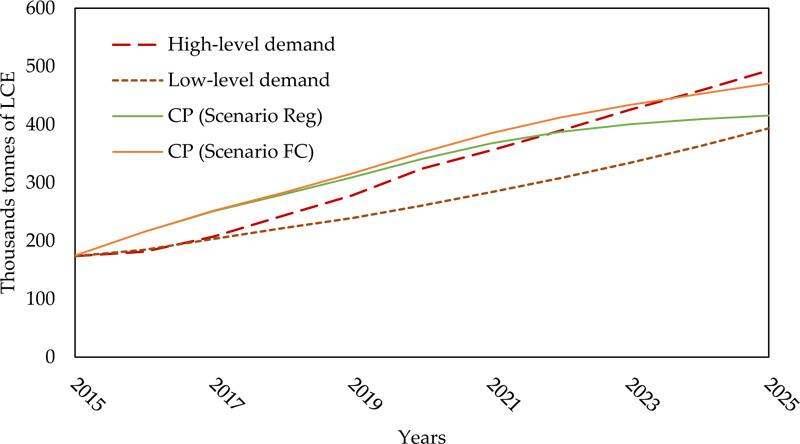
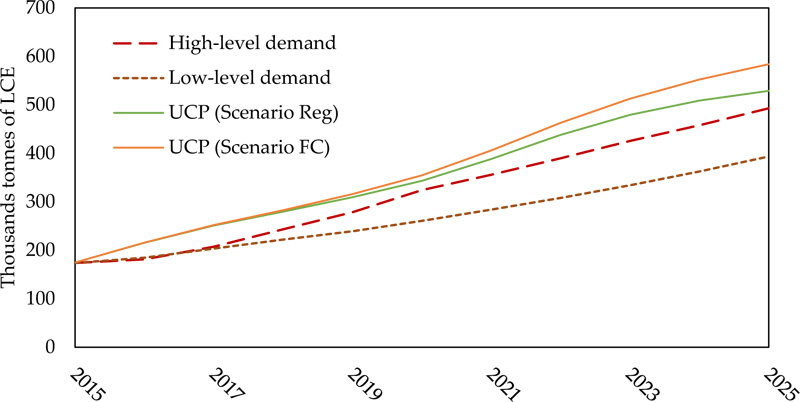
Fig. (10) presents the dynamics of the global supply and demand for lithium, according to Un-Committed Projects (UCP) scenarios. Both the low-level demand and the high-level demand are overpassed by both scenarios of UCP. The result shows that Reg scenario reaches around 529 thousand tonnes of LCE by 2025. It exceeds the low-level demand by 34% and the high-level demand by 7%. The FC scenario reaches around 584 thousand tonnes of LCE by 2025. This scenario exceeds the high-level demand by 18% and the low-level demand by 48%.
CONCLUSION
The present research addresses the question if the global production of lithium will be sufficient to cover the uncertain demand by 2025. The analysis has been performed for three different situations related to the realization of mining projects by the main lithium producers: Chile, Australia, Argentina, and China. The situations under consideration are no new projects in the portfolio, committed projects for 2018, and uncommitted projects for 2020. We considered two scenarios for estimating the growth rate of lithium production in the future: a regular growth rate and a growth rate by assuming the full capacity of lithium production by each major supplier.
Based on the result of the proposed dynamic model, the scenario Reg was able to cover 72% of the high-level demand and 90% of the low-level demand by 2025 if we consider no new projects in the portfolio. In this case, the scenario FC covered 83% of the high-level demand and 100% of the low-level demand by 2025, exceeding it by just 4%. Considering committed projects for 2018, the scenario Reg covered 84% of the high-level demand and 100% of the low-level demand, exceeding it by 6%. The scenario FC covered 95% of the high-level demand and 100% of the low-level demand, exceeding it by 20%. Finally, considering uncommitted projects for 2020, the scenario Reg covered 100% of both low-level and high-level demands. It exceeds the low-level demand by 34% and the high-level demand by 7%. The scenario FC also covered 100% of both low and high demands, exceeding the high-level demand by 18% and the low-level demand by 48%.
Considering that UCP scenarios cover both low and high-level demands, intermediate scenarios between committed projects and un-committed projects could be combined to meet both the demands. This means that the consideration of committed projects in some countries in combination with uncommitted projects in other countries could cover 100% of the demand without excess, as in the case of UCP scenarios.
It is not possible to maintain the current production of lithium in order to satisfy the increasing demand by 2025. The supply of lithium must grow in the coming years either by increasing the production capacity of suppliers or by construction of new processing plants. On the other hand, only by considering uncommitted projects for 2020, both scenarios cover the high-level demand by 2025. Therefore, considering a scenario where electric vehicles and energy storage markets lead to low-carbon emissions and break away from traditional infrastructure network, a high-level demand for lithium can be expected. Therefore, the new uncommitted projects of lithium mining and production should start to operate at least in 2020 to cover this increasing high-level demand.
CONSENT FOR PUBLICATION
Not applicable.
AVAILABILITY OF DATA AND MATERIALS
Not applicable.
FUNDING
This study is supported by National Agency for Research and Development ANID (Fondecyt 1180826), Chile.
CONFLICT OF INTEREST
The author declares no conflict of interest, financial or otherwise.
ACKNOWLEDGEMENTS
The authors acknowledge support from LUT University on the stock and flow model simulations.
APPENDIX A
| Variable | Term | Unit | Equation | Type of variable |
| SG(t) | Global supply of chemical lithium | Tonne LCE |  |
Stock |
| PChile(t) | Lithium primary production by Chile | Tonne LCE |  |
Flow |
| PAustralia(t) | Lithium primary production by Australia | Tonne LCE |  |
Flow |
| PArgentina(t) | Lithium primary production by Argentina | Tonne LCE |  |
Flow |
| PChina(t) | Lithium primary production by China | Tonne LCE |  |
Flow |
| PRest of World(t) | Lithium primary production by countries including Brazil, Canada, Portugal, the US, and Zimbabwe | Tonne LCE |  |
Flow |
| PrBrine(t) | Brine Process | Tonne LCE |  |
Flow |
| PrOre(t) | Ore Process | Tonne LCE |  |
Flow |
| SBrine(t) | Stock of global Brine | Tonne LCE |  |
Stock |
| SOre(t) | Stock of global Ore | Tonne LCE |  |
Stock |
| PrLiCl_1(t) | Lithium chloride process from brine | Tonne LCE |  |
Flow |
 |
Lithium carbonate process from brine | Tonne LCE |  |
Flow |
| PrLiOH_1(t) | Lithium hydroxide process from ore | Tonne LCE |  |
Flow |
 |
Lithium carbonate process from ore | Tonne LCE |  |
Flow |
| PrLi_Concentrate(t) | Lithium concentrate process from ore | Tonne LCE |  |
Flow |
| SLi_Concentrate(t) | Stock of lithium concentrate | Tonne LCE |  |
Stock |
| PrCG_2(t) | Ceramic and glass process from lithium concentrate | Tonne LCE |  |
Flow |
| SLiOH(t) | Stock of lithium hydroxide | Tonne LCE |  |
Stock |
| PrLiOH_2(t) | Lithium hydroxide process from lithium carbonate | Tonne LCE |  |
Flow |
| PrB_2(t) | Battery process from lithium hydroxide | Tonne LCE |  |
Flow |
 |
Stock of lithium carbonate | Tonne LCE |  |
Stock |
| PrLG(t) | Lubricant and greases process from lithium hydroxide | Tonne LCE |  |
Flow |
| PrCC(t) | Continuous casting process from lithium carbonate | Tonne LCE |  |
Flow |
| PrLiCl_2(t) | Lithium chloride process from lithium carbonate | Tonne LCE |  |
Flow |
| PrO_1(t) | Other products process from lithium carbonate | Tonne LCE |  |
Flow |
| PrCG_1(t) | Ceramic and glass process from lithium carbonate | Tonne LCE |  |
Flow |
| PrB_1(t) | Battery process from lithium carbonate | Tonne LCE |  |
Flow |
| PrAl(t) | Aluminum process from lithium carbonate | Tonne LCE |  |
Flow |
| SCC(t) | Stock of continuous casting | Tonne LCE |  |
Stock |
| PrAT(t) | Air treatment process from lithium chloride | Tonne LCE |  |
Flow |
| SAT(t) | Stock of Air treatment | Tonne LCE |  |
Stock |
| SLiCl(t) | Stock of lithium chloride | Tonne LCE |  |
Stock |
| PrLi(t) | Lithium metal process from lithium chloride | Tonne LCE |  |
Flow |
| SLi(t) | Stock of lithium metal | Tonne LCE |  |
Stock |
| PrButyl(t) | Butyl lithium process from lithium metal | Tonne LCE |  |
Flow |
| PrO_2(t) | Other products process from lithium metal | Tonne LCE |  |
Flow |
| PrB_3(t) | Battery process from lithium metal | Tonne LCE |  |
Flow |
| SO(t) | Stock of Other products | Tonne LCE |  |
Stock |
| SAl(t) | Stock of Aluminum | Tonne LCE |  |
Stock |
| SCG(t) | Stock of ceramic and glass | Tonne LCE |  |
Stock |
| Prp(t) | Polymer process from butyl lithium | Tonne LCE |  |
Flow |
| SButyl(t) | Stock of butyl lithium | Tonne LCE |  |
Stock |
| SP(t) | Stock of polymer | Tonne LCE |  |
Stock |
| SLG(t) | Stock of lubricant and grease | Tonne LCE |  |
Stock |
| SB(t) | Stock of batteries | Tonne LCE |  |
Stock |
| Parameter (auxiliary) | Description | Unit | Value Range | Time | Data Sources |
 |
Lithium carbonate primary production by Chile | Tonne LCE | 2326-62,002 | 1984-2015 | [18]–[39] |
 |
Lithium chloride primary production by Chile | Tonne LCE | 416-3674 | 2004-2015 | [21,38–48] |
 |
Lithium hydroxide primary production by Chile | Tonne LCE | 451-5190 | 2005-2015 | [21]–[28], [30]–[32] |
 |
Ore production by Australia | Tonne LCE | 14-77368 | 1982-2015 | [18]–[39] |
 |
Lithium chloride primary production by Argentina | Tonne LCE | 2105-7434 | 1998-2015 | [19]–[28], [30]–[32], [35]–[39] |
 |
Lithium carbonate primary production by Argentina | Tonne LCE | 906-14137 | 1998-2015 | [19]–[28], [30]–[32], [35]–[39] |
 |
Ore production by Argentina | Tonne LCE | 3-110 | 1981-1997 | [18]–[39] |
 |
Concentrate production by Brazil | Tonne LCE | 75-2515 | 1981-2015 | [18]–[39] |
 |
Ore production by Zimbabwe | Tonne LCE | 1451-8368 | 1981-2015 | [18]–[39] |
 |
Ore production by Portugal | Tonne LCE | 95-6333 | 1981-2015 | [18]–[39] |
 |
Carbonate production by China | Tonne LCE | 10000-12000 | 2010-2015 | [26]–[28], [30]–[32] |
 |
Ore production by Canada | Tonne LCE | 15-3553 | 1984-2009 | [18]–[39] |
 |
Brine production by the US | Tonne LCE | 5000-6000 | 2016-2025 | [41] |
| α1 | Brine coefficient | % | 23-78 | 1984-2025 | [18]–[39], [41] |
| α2 | Ore coefficient | % | 22-77 | 1984-2025 | [18]–[39], [41] |
| β1 | Lithium chloride coefficient from brine process | % | 9 | 2015 | [40] |
| γ2 | Lithium carbonate coefficient from brine process | % | 91 | 2015 | [40] |
| ρ1 | Lithium hydroxide coefficient from ore process | % | 9 | 2015 | [40] |
| γ1 | Lithium carbonate coefficient from ore process | % | 68 | 2015 | [40] |
| δ | Lithium concentrate coefficient from ore process | % | 23 | 2015 | [40] |
| I2 | Ceramic and glass coefficient from lithium concentrate process | % | 100 | 2015 | [40] |
| C | Lubricant and greases coefficient from lithium hydroxide process | % | 57 | 2015 | [40] |
| D | Continuous casting coefficient from lithium carbonate process | % | 8 | 2015 | [40] |
| β2 | Lithium chloride coefficient from lithium carbonate process | % | 13 | 2015 | [40] |
| O1 | Other products coefficient from lithium carbonate process | % | 10 | 2015 | [40] |
| I1 | Ceramic and glass coefficient from lithium carbonate process | % | 18 | 2015 | [40] |
| k2 | Battery coefficient from lithium hydroxide process | % | 43 | 2015 | [40] |
| k1 | Battery coefficient from lithium carbonate process | % | 32 | 2015 | [40] |
| A | Aluminum coefficient from lithium carbonate process | % | 1 | 2015 | [40] |
| AT | Air treatment coefficient from lithium chloride process | % | 36 | 2015 | [40] |
| L | Lithium metal coefficient from lithium chloride process | % | 64 | 2015 | [40] |
| O2 | Other products coefficient from lithium metal process | % | 22 | 2015 | [40] |
| k3 | Battery coefficient from lithium metal process | % | 22 | 2015 | [40] |
| Bu | Butyl lithium coefficient from lithium metal process | % | 56 | 2015 | [40] |
| P | Polymer coefficient from butyl lithium process | % | 100 | 2015 | [40] |
| Year | Chile | Argentina | United States | Australia | Brazil | Canada | China | Namibia | Portugal | Russia, URSS | Zimbabwe | ||||
| Lithium Carbonate, Brine | Lithium Chloride | Lithium Hydroxide | Spodumene And Amblygonite | Lithium Carbonate | Lithium Chloride | Brine | Spodumene | Concentrate | Spodumene | Carbonate | Chiefly Petalite | Lepidolite | Minerals Not Specified | Spodumene | |
| 1981 | - | - | - | 28 | - | - | w | - | 2868 | - | - | 1392 | 990 | 60600 | 18126 |
| 1982 | - | - | - | 125 | - | - | w | 90 | 3060 | - | - | 1146 | 998 | 60600 | 10788 |
| 1983 | - | - | - | 168 | - | - | w | 1100 | 2339 | - | - | 860 | 601 | 60600 | 21657 |
| 1984 | 2326 | - | - | 24 | - | - | w | 7200 | 897 | 96 | - | 970 | 1086 | 60600 | 25270 |
| 1985 | 4959 | - | - | 22 | - | - | w | 12300 | 963 | 330 | - | 2160 | 880 | 60600 | 30165 |
| 1986 | 4458 | - | - | 184 | - | - | w | 12703 | 2059 | 3500 | - | 835 | 1800 | 55000 | 32760 |
| 1987 | 6139 | - | - | 178 | - | - | w | 22279 | 2503 | 11500 | - | 1816 | 9380 | 55000 | 14959 |
| 1988 | 7332 | - | - | 119 | - | - | w | 30000 | 1471 | 14000 | - | 1642 | 14109 | 55000 | 15073 |
| 1989 | 7508 | - | - | 120 | - | - | w | 40000 | 1575 | 14000 | - | 1398 | 18264 | 55000 | 20647 |
| 1990 | 9080 | - | - | 69 | - | - | w | 40000 | 475 | 12000 | - | 1264 | 10600 | 55000 | 19100 |
| 1991 | 8580 | - | - | 287 | - | - | w | 40400 | 1560 | 12000 | - | 1190 | 10000 | 50000 | 9190 |
| 1992 | 10823 | - | - | 620 | - | - | w | 42516 | 1600 | 18500 | - | 1162 | 15904 | 45000 | 12837 |
| 1993 | 10369 | - | - | 300 | - | - | w | 52900 | 1600 | 18900 | - | 742 | 13289 | 40000 | 18064 |
| 1994 | 10439 | - | - | 400 | - | - | w | 45987 | 1600 | 20000 | - | 1861 | 11352 | 2000 | 25279 |
| 1995 | 12943 | - | - | 400 | - | - | w | 81841 | 1600 | 21000 | - | 2611 | 8740 | 2000 | 33498 |
| 1996 | 14180 | - | - | 400 | - | - | w | 117094 | 1600 | 22000 | - | 1972 | 7626 | 2000 | 30929 |
| 1997 | 24246 | - | - | 697 | - | - | w | 88399 | 6948 | 22500 | - | 1019 | 6883 | 2000 | 49833 |
| 1998 | 28377 | - | - | - | 6000 | 2500 | w | 63190 | 9485 | 22500 | - | 500 | 7000 | 2000 | 28055 |
| 1999 | 30231 | - | - | - | 1592 | 2794 | w | 75824 | 11122 | 22500 | - | - | 14862 | 2000 | 36671 |
| 2000 | 35869 | - | - | - | 2161 | 5182 | w | 65504 | 10875 | 22500 | - | - | 9352 | 2000 | 37914 |
| 2001 | 31320 | - | - | - | - | 4512 | w | 79859 | 9084 | 22500 | - | - | 11571 | 2000 | 36103 |
| 2002 | 35242 | - | - | - | 906 | 4729 | w | 79085 | 12046 | 22500 | - | - | 16325 | 2000 | 33172 |
| 2003 | 41667 | - | - | - | 2850 | 4700 | w | 124410 | 9755 | 22500 | - | - | 24606 | 2000 | 12131 |
| 2004 | 43971 | 494 | - | - | 4970 | 6303 | w | 118451 | 9084 | 22500 | - | - | 28696 | 2200 | 13710 |
| 2005 | 43091 | 681 | 504 | - | 7288 | 8416 | w | 173635 | 8924 | 22500 | - | - | 26185 | 2200 | 37499 |
| 2006 | 46241 | 1166 | 3794 | - | 8228 | 8336 | w | 222101 | 8585 | 22500 | - | - | 28497 | 2200 | 30000 |
| 2007 | 51292 | 4185 | 4160 | - | 8863 | 8828 | w | 192277 | 7991 | 22500 | - | - | 34755 | - | 30000 |
| 2008 | 48469 | 4362 | 4050 | - | 9984 | 7800 | w | 239528 | 14460 | 22000 | - | - | 34888 | - | 50000 |
| 2009 | 25154 | 2397 | 2987 | - | 8450 | 4350 | w | 197482 | 15929 | 10000 | - | - | 37359 | - | 50000 |
| 2010 | 44025 | 3725 | 5101 | - | 11196 | 6832 | w | 295000 | 15733 | 0 | 12000 | - | 40109 | - | 47000 |
| 2011 | 59933 | 3864 | 5800 | - | 10000 | 4600 | w | 421396 | 7820 | 0 | 11300 | - | 37534 | - | 48000 |
| 2012 | 62002 | 4145 | 5447 | - | 10535 | 4297 | w | 456921 | 7084 | 0 | 10000 | - | 20698 | - | 53000 |
| 2013 | 52358 | 4091 | 4197 | - | 9248 | 5156 | w | 421000 | 7982 | 0 | 11200 | - | 19940 | - | 42000 |
| 2014 | 55074 | 2985 | 4194 | - | 11698 | 7370 | w | 425000 | 8519 | 0 | 10100 | - | 17459 | - | 45000 |
| 2015 | 50418 | 2069 | 3888 | - | 14137 | 5848 | w | 490000 | 8500 | 0 | 10700 | - | 17120 | - | 50000 |
| 2016 | 67300 | 1600 | 6000 | - | 25500 | 6000 | w | 560000 | 8500 | 0 | 12200 | - | 25800 | - | 50000 |

