All published articles of this journal are available on ScienceDirect.
Analysis of the Effect of Separate Collection on the Composition of Mixed Municipal Solid Waste in Italy
Abstract
Separate collection of municipal solid waste (MSW) is mandatory in Italy, and an increasingly higher standard of efficiency is applied; in fact, the target value set by regulation is 65%.
In the last 20 years, separate collection efficiency increased from 9.4% with 80% national MSW landfilled, and only one region was over 25% separate collection to 58.1% with 22% national MSW landfilled and 12 of 20 regions over 55% separate collection. However, significant differences are present in the three Italian macro regions (North, Center and South).
This paper analyzes the composition of waste carried in most Italian regions to evaluate the effect of separate collection on the composition of mixed municipal solid waste (unsorted). Moreover, a regression analysis on the same data allows to assess this latter as a function of separate collection efficiency.
1. INTRODUCTION
Separate collection of municipal solid waste (MSW) is mandatory in Italy and an increasingly higher standard of efficiency is applied; in fact, the target value set by regulation is 65% [1].
In the last 20 years, separate collection efficiency increased from 9.4% with only one region over 25% to 58.1%, whereas 12 of 20 regions are over 55% separate collection [2]. At a national level, MSW landfilling decreased from 80% to 22%. However, significant differences are present in the three Italian macro-regions (North, Center, and South).
The generation of MSW has shown a slight increase during recent years. According to ISPRA [2], 30,2·106 Mg of MSW was produced in 2018 corresponding to about 500 kg·inhabitant-1·year-1.There are significant differences across regions. In Northern Italy, MSW production has been 517 kg·inhabitant-1·year-1 with the separate collection of 67.7%, while Central Italy and Southern Italy recorded 548 kg·inhabitant-1·year-1 with 54.1% separate collection and 449 kg·inhabitant-1·year-1 with 46.1% separate collection, respectively.
The level of separate collection is increasing in all the Italian regions: Veneto reached the highest separate collection rate (73,8%) in 2018 and is followed by Trentino-Alto Adige (72,5%) and Lombardy (70,7%).
According to the ISPRA report [2], in 2018, 22% of MSW in Italy was landfilled, 18% was incinerated, and 49% was sent for materials recovery (i.e., 21% organics and 28% other “dry” fractions). Minor quantities were treated by other means.
Mechanical and biological treatment (MBT) plays an important role in the waste management of unsorted waste destined to landfilling or incineration [3, 4]. In Italy, MBT is widely adopted before landfill disposal following EU and National directives that call for increased biological stability [5]. For waste sent to incineration, treatment is necessary to obtain a suitable fuel for fluidized bed plants. According to 2018 National data, 94% of MSW is treated (mainly MBT) before final disposal in a landfill, and 49% of incinerated waste also pretreated [2].
In 2018 at the National level, MBT plants treated almost 9.1 million tons of unsorted waste, 250 thousand tons of other MSW fractions, and 1 million tons of waste coming from MSW treatment [2].
Information on the composition of residual waste is important for proper management. The specific aim of this study is to analyze the composition of residual waste as a function of the separate collection rate as influenced by territorial factors.
2. METHODS
Residual waste composition, although is quite regularly checked in MBT, landfills and incineration plants by managers and control authorities, is not reported in official documents systematically compiled. For this reason, research and organization of data have been the first step of this work.
The waste composition analysis (e.g [6-23]) was associated with the corresponding separate collection rate. If this value was not reported, it has been replaced with information reported in official documents at the province level for the same year.
Collected data appeared very heterogeneous in terms of considered waste fractions, sampling area and year. A total of 148 waste composition analyses (41 for the North of Italy, 87 for Center and 20 for South) have been considered in this study. Data covered 15 of 20 regions: Aosta Valley, Lombardy, Liguria, Piedmont, Friuli-Venezia Giulia, Veneto, Trentino-Alto Adige, grouped as North; Tuscany, Lazio, Umbria, Marche, grouped as Center; Campania, Calabria, Apulia and Sardinia, grouped as South. This distinction follows ISPRA official rules.
Waste fractions considered were organic, garden waste, wood, paper, cardboard, metals, plastic, textiles, glass, diapers, sanitary pads, and other waste. Some waste has been grouped by the major (Table 1).
| Waste Fractions |
|---|
| Organic (kitchen waste) + garden waste + wood |
| Paper + cardboard |
| Plastic |
| Diapers + sanitary pads |
| Glass |
| Metals |
| Textiles |
| Other waste |
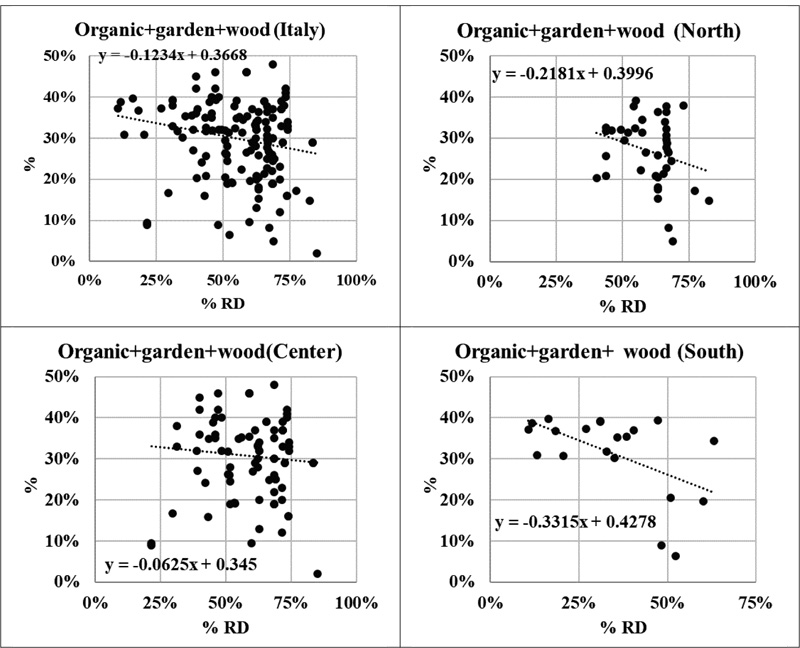
In order to verify general tendency, a linear regression model has been used (Fig. 1). On a National level, the composition of mixed waste at 0, 25, 50 and 75% separate collection efficiency has been generated by linear regression for the most predominant fractions (i.e., organic + garden waste + wood, paper + cardboard, metals, plastic, textiles, glass, diapers + sanitary pads, and “other waste” (remaining portion).
3. RESULTS AND DISCUSSION
Figs. (1-8) show the results of the analysis of the available data for the waste fractions indicated in Table 1.
In general, it should be considered that the waste fractions that are more actively sorted by customers tend to reduce their presence in mixed waste and separate collection efficiency increases. This concept is known as “interception”. The selected, normally recyclable, waste fraction is “intercepted”, sorted and sent for recycling/processing. The higher the interception, the greater the slope of the regression line. On the contrary, if a waste fraction is not actively sorted or if it not destined to sorting as, in most of the collection systems (i.e., diapers and hygienic pads), the tendency is towards an increase of the presence in the mixed waste with an increasing separate collection efficiency. The intercept of the regression line estimates the amount of the selected waste fraction in the absence of separate collection. The sum of organic, garden waste and wood is the most abundant waste fraction in Italy, representing 37% of total waste as these fractions, at the household level, are collected together in Italy with a 0% separate collection.
The significant decrease in highly efficient separate collection systems (Fig. 1) verifies that the selection of organics by customers is active, especially in the North and in the South areas. Some outlier values are present. A possible explanation is the implementation of policies for household composting and the traditional use of kitchen waste for animal feeding in rural areas. A reduction in the waste management fee is normally given to households that use this practice.
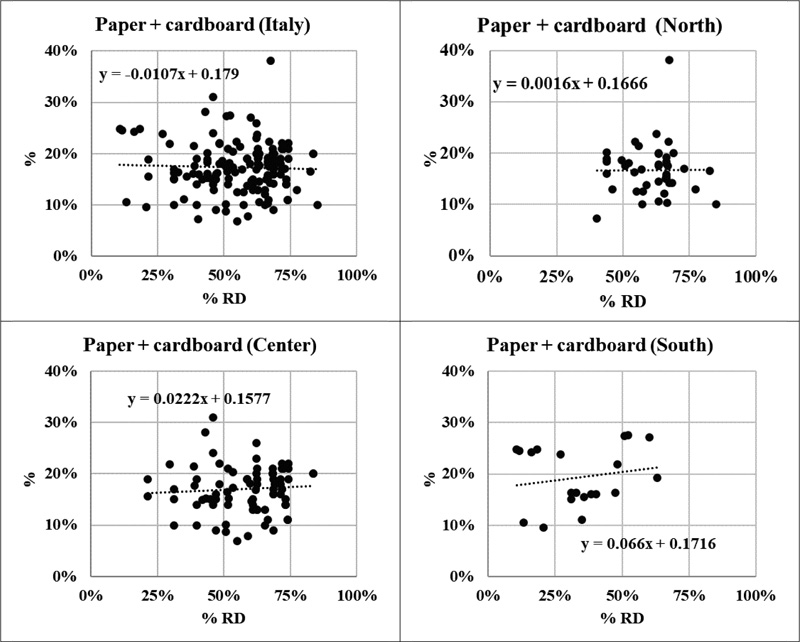
The results obtained for cellulosic waste (paper and cardboards) at the National level (Fig. 2) show a tendency to a uniform presence in mixed waste with an increasing separate collection efficiency. If the three geographic areas are separately considered, a very slight increase can be noted. In general, paper and cardboard represent a share of close to 20% of mixed waste.
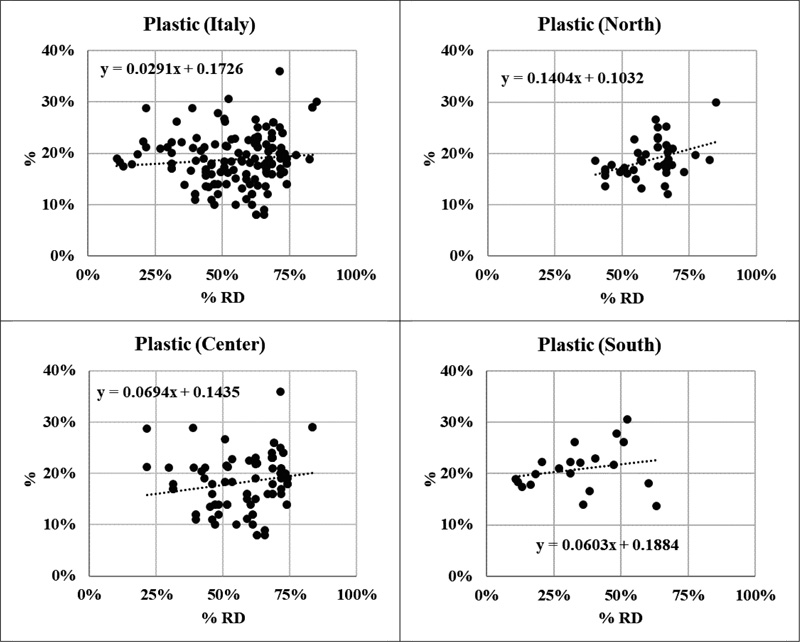
Data for plastic (Fig. 3) show that this fraction tends to concentrate on mixed waste due to a lower than average sorting by customers. This could be due to a lack of proper information on the destination of some plastic items (e.g. single use plates and glasses) and to the general use of discarding stained mixed waste plastic containers with food waste. It is also interesting that the share of plastic in mixed waste seems to increase from North to South.
Diapers and sanitary pads (Fig. 4) are normally not destined for recycling. The first smart plants, which could recover about 75 kg of plastic, 75 kg of super absorbent polymer, SAP, and up to 150 kg of cellulose from 1 ton of adsorbent products, has been only recently opened in Lovadina di Spresiano, province of Treviso, by FaterSMART company [24] and therefore their presence in mixed waste should decrease with increasing separate collection efficiency. This is confirmed by data at the National level for two of the three macro-regions. The tendency for Center is quite unexpected, but it is not considered significant. The presence of diapers and sanitary pads can be estimated in the 5-10% of mixed waste, with some outliers in the higher side between 20 and 30%.
With the exception of an outlier that impacts the interpretation of the glass (Fig. 5) data for the South macro-region, it is clear that glass is actively sorted and that its presence in residual waste is scarce (in the order of 3-5% in most cases).
Metals (Fig. 6) are present in municipal waste mainly as cans and tins and, as shown by data, are separately collected since their recycling potential is well known to Italian customers.
Textiles (Fig. 7) are often neglected in waste composition. Their separate collection is not uniformly present in the country. In many cases, they are collected by non-profit organizations and destined either for reuse or recycling. This lacking of operational uniformity is witnessed by some very high values (> 20%), especially in the North macro-region. In general, the management of the textile waste fraction should gain importance since it can be estimated that it represents 5-10% of the residual waste. The other waste fractions (Fig. 8) represent, in general, a minor share of total waste (5-10%).
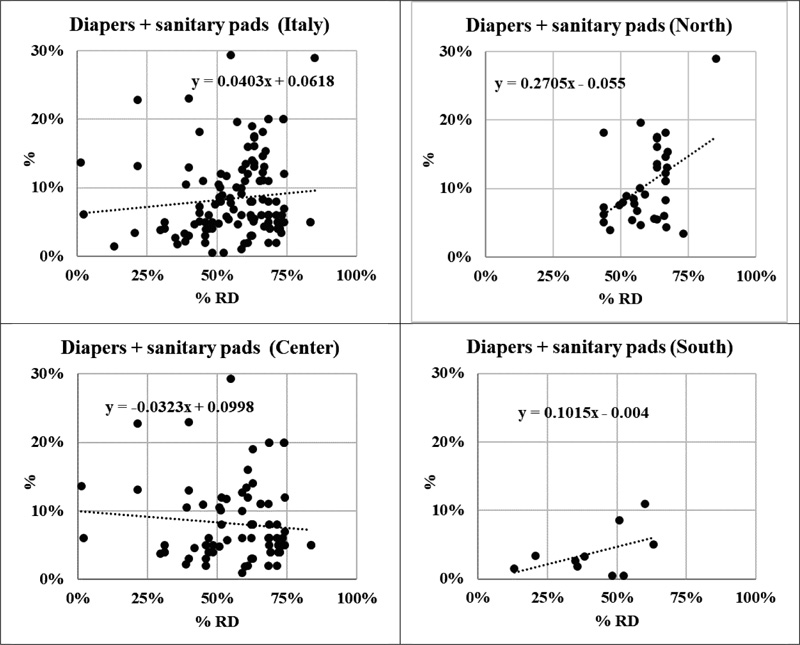
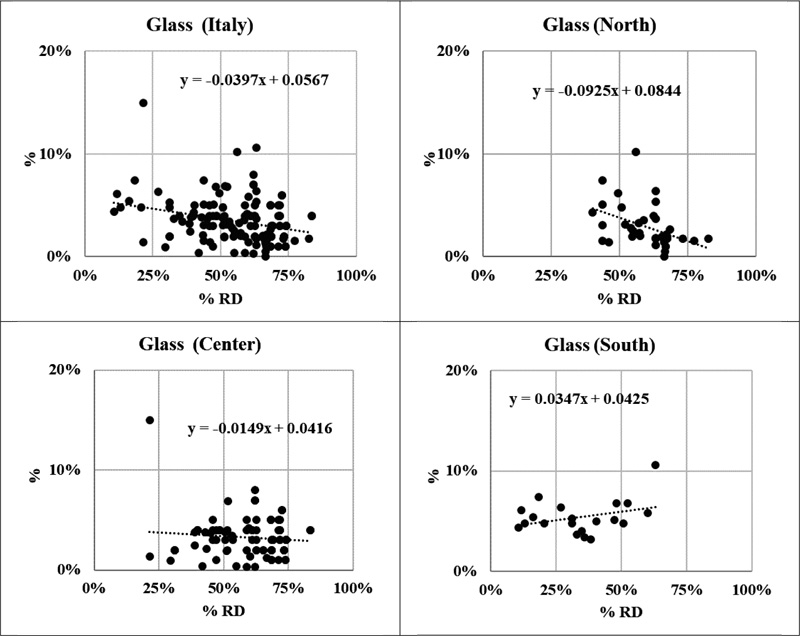
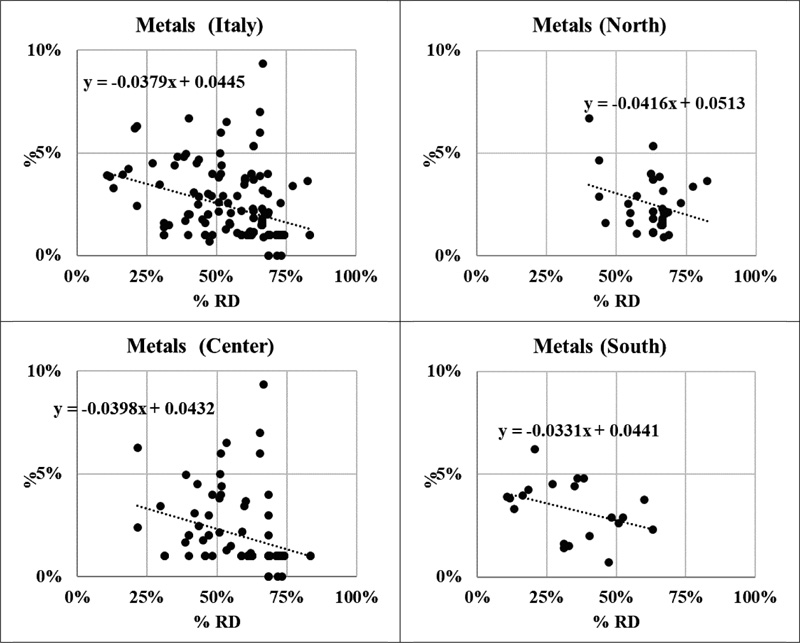
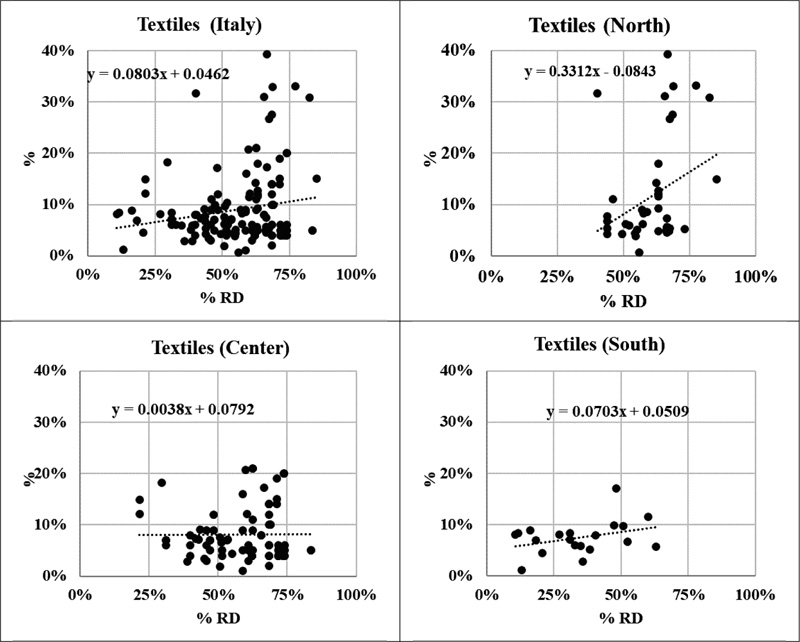
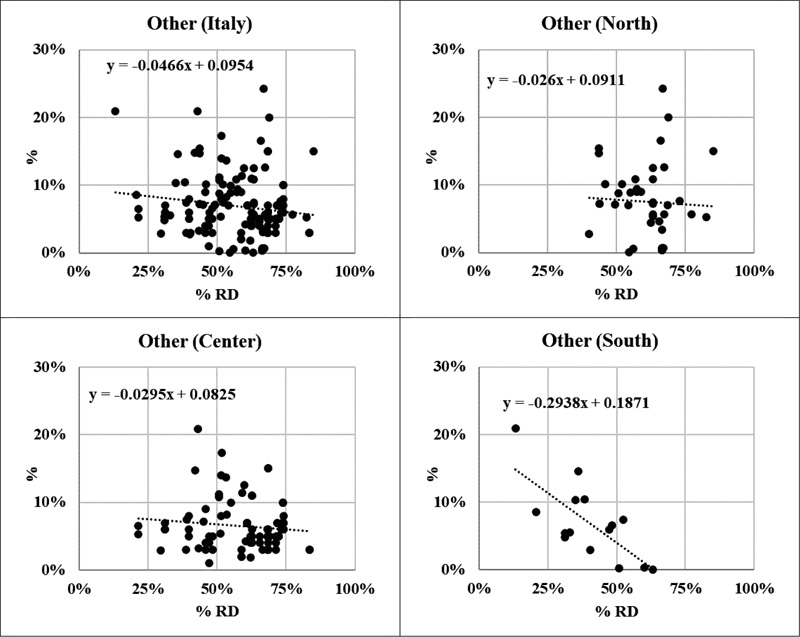
Table 2 shows the composition of Italian mixed municipal waste estimated by the regression of data used in this research. The three main fractions of MSW (Organic +garden waste +wood, Paper + cardboard and Plastic) represent about 72% of the total at 0% separate collection; while their main waste fraction presence reduces to 64% at 75% separate collection. This results in an increase of minor waste fractions, especially diapers and sanitary pads (+49%), textiles (+130%) and of the other minor waste fractions (+64%). Among the recyclable fractions, Glass (-53%) and Metals (-64%) are most influenced by separate collection.
| - | Separate Collection Efficiency | |||
|---|---|---|---|---|
| Waste fractions | 0% | 25% | 50% | 75% |
| Organic (kitchen waste) + garden waste + wood | 36.7% | 33.6% | 30.5% | 27.4% |
| Paper + cardboard | 17.9% | 17.6% | 17.4% | 17.1% |
| Plastic | 17.3% | 18.0% | 18.7% | 19.4% |
| Diapers + sanitary pads | 6.2% | 7.2% | 8.2% | 9.2% |
| Glass | 5.7% | 4.7% | 3.7% | 2.7% |
| Metals | 4.5% | 3.5% | 2.6% | 1.6% |
| Textiles | 4.6% | 6.6% | 8.6% | 10.6% |
| Other waste | 7.2% | 8.8% | 10.3% | 11.9% |
If cellulosic materials are reduced, the composition analysis estimates higher biological waste stability due to the reduction of readily biodegradable waste and a lower methane potential. Confirming the data of [25], at high level of separate collection, mixed municipal waste is a better fuel for incineration plants due to the reduction of both water content (“wet” organics reduces by 25%) and inert material (e.g. metals, glass) and the increase of the presence of plastic (+13%).
CONCLUSION
The analysis of available data allowed an assessment of the effect of increasingly higher levels of separate collection efficiency on Italian mixed municipal waste composition.
Some fractions (i.e. textiles, sanitary pads, diapers) often neglected in normal waste management systems should be better managed since their presence in mixed municipal waste is significant.
The separate collection of municipal waste modifies many characteristics of mixed waste (e.g. biological stability, water content, calorific value that have an impact on subsequent treatments (i.e. incineration, MBT, landfilling). Future research should investigate in detail and quantify the effects on biological properties (i.e., biological stability and biomethane potential).
CONSENT FOR PUBLICATION
Not applicable.
AVAILABILITY OF DATA AND MATERIAL
Not applicable.
FUNDING
None.
CONFLICT OF INTEREST
The authors declare no conflict of interest, financial or otherwise.
ACKNOWLEDGEMENTS
Declared none.

