All published articles of this journal are available on ScienceDirect.

Developing a CDY Model for Grapes and Experimentally Validating it with an Android App that Focuses on Agro-climatic and Disease Prevention Aspects
Abstract
Introduction:
Crop development and yield are both influenced by the weather. This study has developed and analytically resolved a general agro-climatic model for grapes.
Methods:
In the field of mathematical biology, researchers, professors, and academics will find this model useful. To create the final version of the model for yield prediction, the CDY model and asymptotic analyses have been performed. Climate, disease, and grape production have been taken into consideration as dependent characteristics during the model construction process. The frequency of infection, the occurrence of disease, seasonality, and the elimination of grape output throughout each harvest cycle have been viewed as distinct qualities. Moreover, the model has been examined, and field-level data have been used to estimate the parameters collected between 2016-2021 from the nearby villages of GRS and Theni.
Results:
A description of this model’s stability analysis has also been provided. An association has been determined between the numerical validity and stability of the given analytical solution analyses. In addition, the developed Android mobile app for grapes has been validated using the proposed model under the climatic scenario.
Conclusion:
It is advised to apply the created model to estimate grape yield based on the findings obtained. A useful technique for forecasting crop yield has thus been proposed in this study.
1. INTRODUCTION
Vine growth, production, and fruit quality are all significantly influenced by climate. Climate is the most important factor in determining how successfully grapes may be grown. The weather factors, including sunlight, precipitation, and humidity, also have an impact on how well the fruits develop.
One of the most significant vineyard diseases in Tamil Nadu is known as downy mildew (Plasmopara viticola), which can rapidly grow, spread, and cause significant crop losses, depending on the local weather [1]. Farmers must choose which agrochemicals to employ, how often to spray for downy mildew, and whether to do so or not [2]. It is essential to have a solid understanding of the stage of the occurrence and circumstances surrounding the disease's congenial onset and progression. Fungicides' effectiveness and method of action contribute to the efficient control of any disease, especially downy mildew.
Infections induced by P. viticola sporangia are projected to cause DM outbreaks on a large scale in Switzerland, France, Austria, Germany, and Italy, as assessed using several mathematical models [3-10]. These models are created utilising a shared database of prior works.
The SIR model was updated by Christopher et al. [11] to include the host response to infection burden. A model was also developed for the temporal dynamics of brown rot spreading in fruit orchards by Daniele et al. [12]. Researchers have looked at the dynamics of foliar pathogen and bio-control agent (BCA) populations by Jeger et al. [13] in an attempt to estimate the probability of effective bio-control in relation to the methods at play. Using a dynamic system approach, Abdul Latif developed the concept of induced resistance to plant disease [14]. Mario de la Fuente evaluated various techniques for predicting grapevine output [15]. The Bayesian growth model was created by Rory Ellis et al. [16] to simulate and predict grape yield. Vittorio Rossi developed a dynamic model for determining Plasmopara viticola initial infections in the grapevine using a mechanistic approach [17]. A generic mathematical model for preventing disease infection based on elicitor effects was first presented by Abdul Latif [18]. In order to estimate yield during the grapevine's developing stages and identify highly significant predictive variables, for each phenology, Manisha S. Sirsat et al. [19] created a predictive model. Eswari et al. [20] analysed modeling for induced resistance to plant disease using biological control agents. In recent years, Estefana Gonzalez Fernandez has used aerobiological, climatic, and floral production studies to create a prediction model for the Godello cultivar, which is one of the preferred autochthonous white cultivars in the Northwest Spain Ribeiro designation of Origin vineyards [21]. More recently, using multiple linear regression analysis, Kadbhane et al. [22] have constructed the ACGY model for assessing grape output in a scenario of climate change (secondary data). DobreiAlina [23] et al. examined the interactions between crop burden (B - buds number) and a range of production parameters. Using mathematical models and irrigation quotas, Lijun Su et al. [24] created a method to simulate LAI and determine the yield of grape plants. By utilising satellite-based time-series pictures and a machine-learning methodology, Sara Tokhi Arab et al. [25] have improved the models. The effects of climate change on wine quality have been assessed by Vittorio Faluomi [26] using mathematical simulations of vine and grapevine development. Eswari et al. [27] have developed an agro-climatic grape yield prediction model for the study area in the Theni district only based on current and future climate data.
Sharad Kadbhane [28] carried out an analysis of the agro-climatic factors and grape output in the Nashik district. An application (app) designed by Liu et al. [29] running on an Android client could immediately provide growers with information on the variety by automatically and in real-time identifying the wine grape. Smita N. Solanki [30] developed a mobile phone-based solution to help farmers in farm’s management, leading to agricultural yield improvement and helping in various practices carried out on the farm. The impact of mobile phones on the production sector in India can be examined with a closer focus on small farmers. A novel strategy for reliable grape quality attribute prediction that combines open-source AutoML approaches, NDVI data acquired at various growth stages, and non-destructive techniques, like remote sensing, is employed in precision viticulture [31]. Different commercial grapevine varieties' output and real berry count were assessed by Javier Tardaguila et al. [32]. Quantifying the visible berries and extracting canopy attributes were both made possible by the method based on deep learning and computer vision.
According to the literature study, there are several yield-estimating models that may be used to predict the yield of crops, including sugarcane, wheat, rice, maize, sorghum, etc. There are no models for grapes available for estimate without secondary data. There are not any models documented, for precisely estimating grape production, in Indian terrain up to this point. The goal of the current study was, thus, to use historical and projected climate data to develop a CDY model for agro-climatic grape yield prediction for the research area in the Theni district. The relationship between the climate, disease, grape yield, and the rates of infection, occurrence, seasonality, and elimination of grape yield loss per harvest time has not yet been the subject of a general model or analytical conclusions to the best of the authors’ knowledge. When the resultant analytical solution is compared to the numerical and stability analysis, a reasonable level of agreement is discovered. Moreover, the fundamental reproduction number for the grape yield forecast model is acquired.
2. MATERIALS AND METHODS
2.1. Mathematical Formulation of the Problem
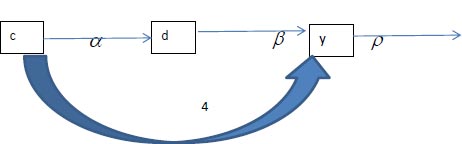
It is simple to apply and use the conventional CDY model, a system of three ordinary differential equations (ODEs), to better understand the grape production prediction over time, including any potential climatic effects. A dynamic system is created by three connected ordinary differential equations that describe the temporal evolution of the next three components:
1. The climatic effect, C(t): These are the vineyards that are not now contaminated, but might be. Vineyards that are vulnerable may get the disease or continue to be vulnerable.
2. Disease, D(t): These are the vineyards that have already contracted the disease due to the climate and can spread it to vineyards that are vulnerable. A sick grapevine may continue to grow on the infected plant or it may be removed and allowed to heal or perish.
3. Yield Y (t): These are the vineyards that are believed to have recovered from the illness.
The CDY model, which is based on these presumptions and ideas, uses the following system of ODEs, to control the rates of change in the three equations.
Assuming that the developing factors include temperature, relative humidity, rainfall, and the yield forecast model, wet days will all be regarded as climatic domain characteristics. Downy mildew disease and yield are denoted by D and Y. The schematic diagram for the agro-climatic disease grape yield model's real-life theoretical results is presented in Fig. (1).
The domain's metrics include the incidence of diseases, the rate of infection, and the pace at which harvest season yield loss is eliminated. It is taken into account when creating the asymptotic analysis-based model for predicting grape yield in an agro-climatic environment. The model's fundamental structure is shown below [27]:
 |
(1) |
 |
(2) |
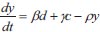 |
(3) |
Thus, the starting conditions are
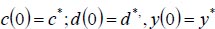 |
(4) |
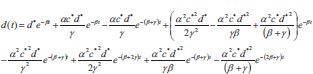
Using the asymptotic method to solve equations (1-3), where c is the climatic effect, d is the downy mildew disease, y is the yield, t is the time in days, α αis the infection rate for grapes, β is the disease incidence rate for grapes, γ is the seasonality rate, and ρ is the removal rate of grape yield loss per harvest time, we can obtain the following:
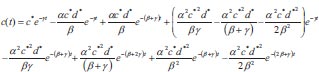 |
(5) |
 |
(6) |
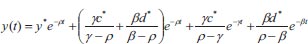 |
(7) |
3. LOCAL STABILITY ANALYSIS
3.1. Equilibria
An equilibrium point is a location where a system's variables are steady throughout time. The equilibrium  can be found in equations (1)–(3), and this equilibrium point is a stable one for the system. A system will gradually return to its steady state if it is in a stable steady state and is only slightly perturbed from the steady state.
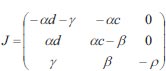
As a result, little variations in crop production will not upset the balance. This equilibrium should be seen in the natural world. In this approach, conduct that is physically viable is often determined by stability. It is established that equations (1) through (3) behave in a linearized fashion at equilibrium. To evaluate this, a Jacobian matrix is required [27].
 |
At an equilibrium point
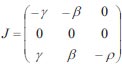 |
Eigenvalues of the Jacobian matrix are λ1 = 0,λ2 = -ρ,λ3 = -γ
In the system, Re(λi)< 0, so the given system is stable. It is clear to see that the system (1)-(3) has disease-free equilibrium  . Let X = (c,d,y)T, then the system (1)-(3) can be written as X = F(X) - V(X).
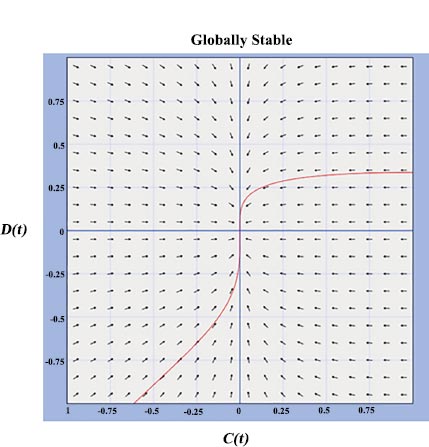
Fig. (2) shows a direction field numerical analysis of stability.
Thus, if R 0 = spectrum(FV-1), the system in question is globally stable. It studies the dynamic behaviour and develops a yield forecast model. Moreover, it bears the fundamental reproduction number, R 0, which plays a crucial role. The disease-free equilibrium is reached, when the fundamental reproduction number is less than or equal to one, where disease finally dies out, demonstrating the global stability of the equilibria. Fig. (3) makes it clear that both the upper and lower positive states as well as the globally stable state are stable nodes. It is clear that the CDY model for grapes is more accurate at predicting yield and is globally stable in the disease-free equilibrium.
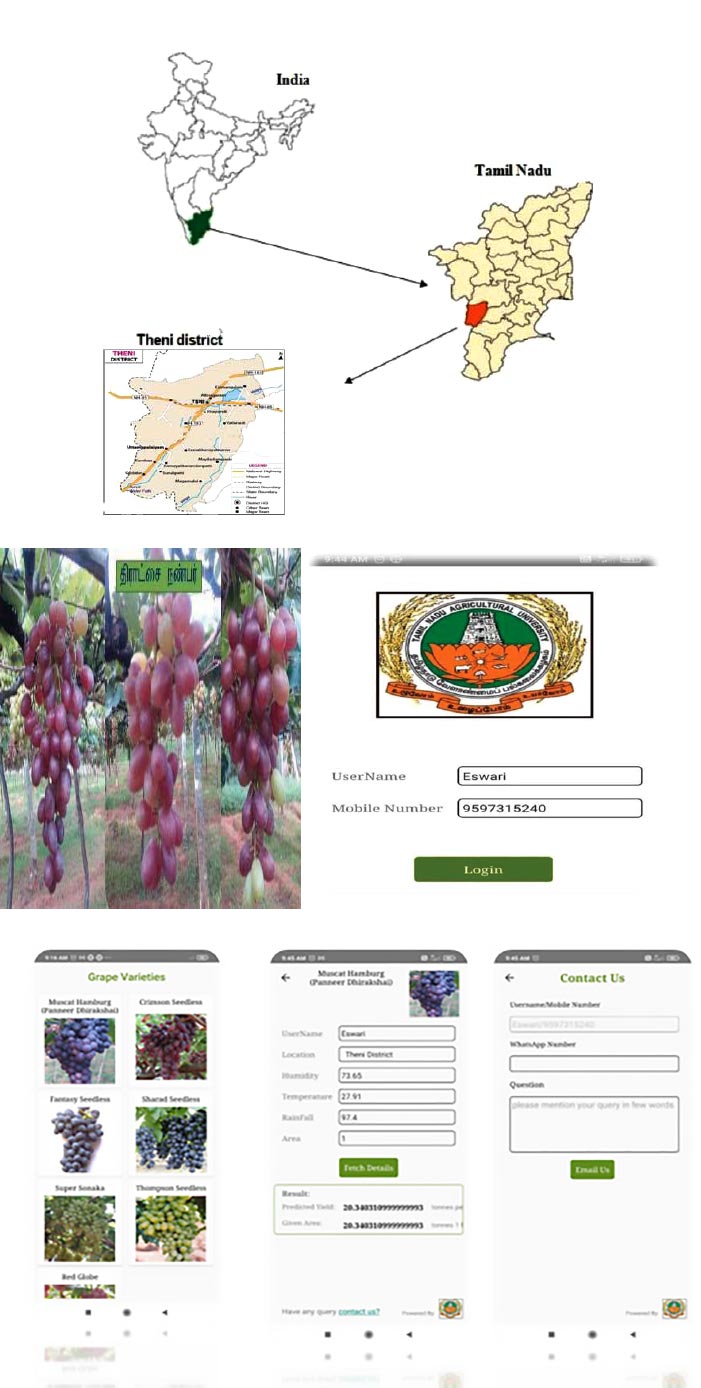
3.2. Application and Validation of Android Mobile App using the Proposed Model
Due to their compatibility with farming's inherent mobility, low cost, and ability to produce a wide range of useful applications, Android apps have become an important tool in agriculture. Additionally, modern Android apps come with a variety of physical sensors, making them a viable tool for assisting with a range of farming duties. Applications for Android phones that fall under the agricultural category help farmers cultivate crops by monitoring their surroundings with a variety of sensors. Photographs taken at certain farm places, and notes made on the colours of the soil, water, plant leaves, and light can all be considered observations. The application's primary target users frequently work to increase farm output by examining agricultural samples, assisting with agricultural decisions and resolving task-specific issues. The data on yield, intensity of diseases, weather data on temperature, rainfall (intensity and frequency), and humidity, from 2016 to 2021, were collected from the Theni district. The developed mathematical model for yield prediction and disease forecasting under different climatic conditions in the sample area was validated using an Android app. The created model was used to assess the decline in grape output. Using this suggested model, decisions could be made to help farmers produce more grapes. The developed mobile app will be helpful for grape farmers to avoid unnecessary applications. It can be used to control disease outbreaks in grapevines. It predicts the growth and fruit development pattern of grapes. The current study was carried out to create an Android app, taking into account the aforementioned data, and validate a mathematical model for grapes with regards to climate conditions and disease incidence.
This app is a farmer-friendly app; it is easy to download this app on mobile or laptop. After downloading, the login page of this app can be opened and the username and password can be entered to login into it. In this app, the varieties of grapes are pictorially shown from the Grape research station, Theni district. Any one variety can be clicked to open the input details page related to climatic factors, such as temperature, relative humidity, and rainfall within the area. All such inputs are provided to estimate an output for grape yield prediction. Using this app, every farmer can estimate grape yield for future perspective.
4. NUMERICAL SOLUTION
To evaluate the precision of this analytical technique, the model’s formulation equation was numerically solved. Initial value problems can be resolved using the program Matlab; thus, it was used to numerically solve Eqs. (1-3). The comparison showed a strong visual and tabular analytical agreement between the numerical values. The results related to the seasonality rate, disease incidence, infection rate, and removal rate of yield loss per harvest time have been obtained utilising field-level data for the years 2016 through 2021 (Table 1). The findings from the numerical and analytical approaches demonstrated the same error percentage.
5. RESULTS AND DISCUSSION
5.1. Experimental Work in the Field
The study has been conducted on established grapes vineyards with Muscat Hamburg variety in a plot size of 30 x 6 m2 (30 vines). The experiment plot involved 30 vines, which were maintained without fungicide sprays during the growing season so as to observe the development of downy mildew disease. To identify the oil spot symptom, the third or fourth leaf in a vine was marked separately using a label, and thus, a total of 75 leaves were marked per replication. The occurrence of the symptom as the oil spot was considered further for observing disease development for scoring at the scale of 1-9 and calculation of the percent disease index [14, 15].
We have surveyed the grapes growing areas to assess the incidence of downy mildew from 2016 to 2021. The disease incidence was assessed using data collected from the grapes vineyards located in the Cumbum, Chinnamanur, and Uthamapalayam blocks of the Theni district. For the purpose of gathering data on disease incidence levels, 15 vineyards have been chosen. From the chosen vineyards, observations on the disease incidence have been gathered twice weekly. The results of the survey have demonstrated downy mildew as a serious illness compared to other infections. Downy mildew has also been found to be a significant illness, particularly 0–60 days following forward (fruit) trimming. Between 2016 and 2021, the prevalence and severity of downy mildew disease at the field level have been evaluated. Using the field-level data, the proposed model could be validated, and the results are presented in Fig. (4). The rate of crop loss per harvest time, illness incidence, infection rate, and seasonality index are the new analytical representations of climate, disease, and yield, as shown in Eqs. (5-7). The fluctuating relative frequencies of infection, illness severity, and practical seasonality all have an impact. Field-level data were compared with that of the agro-climatic grape yield model and the numerical findings, the infection rate, seasonality index, and disease severity have been taken into account with respect to the time in days, as shown in Fig. (4). The chart shows that when the disease automatically increases, climate rises, and other yields initially become zero. However, after a long period, the climate declines, with increasing production, inducing a natural decline in the disease.
| S. No. | Parameter |
Experimental Value (Mean value) |
|---|---|---|
| 1. | Infection rate (α) | 23.98% |
| 2. | Disease incidence (β) | 24.04% |
| 3. | Seasonality rate (γ) | 90% |
| 4. | Removal rate of grape yield per harvest time (ρ)(yield loss from GRS) | 0.2 to 0.6% |
| 5. | Disease at the initial time (d*) | 0 |
| 6. | Yield at the initial time (y*) | 0 |
| 7. | Climatic effect at the initial time (c*) (minimum temperature) | 33°c |
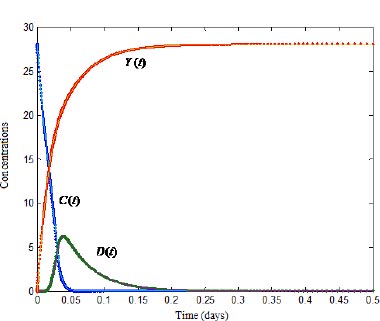
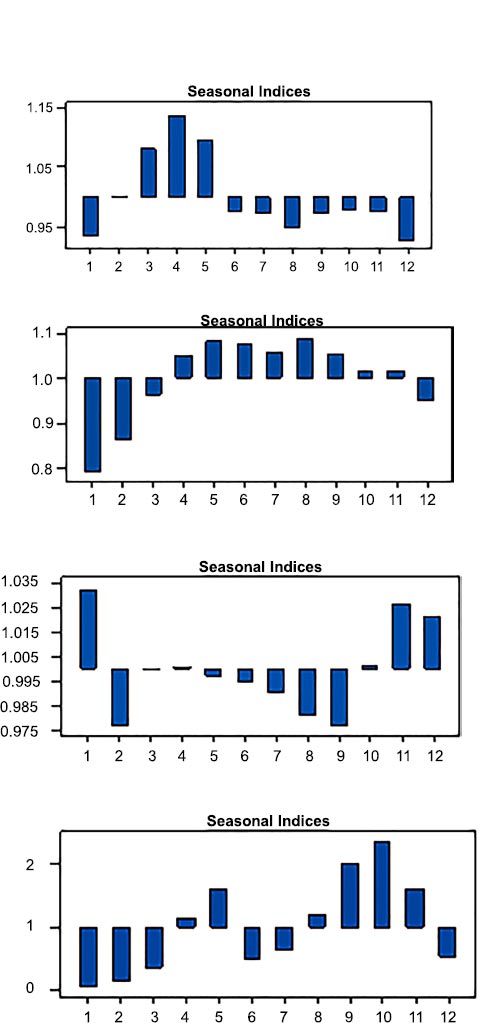
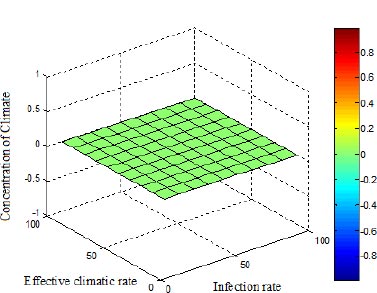
Fig. (6) depicts the three-dimensional spatial distribution of the climate for varied effective seasonality and infection rates. The climate is self-governing of both α and γ; nevertheless, C* diminishes the climatic effect.
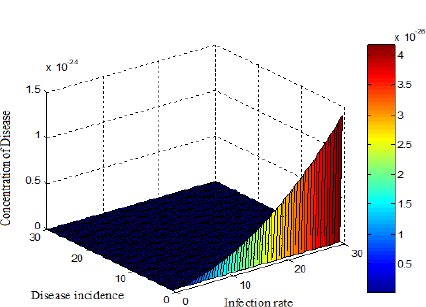
According to Fig. (7), the disease varies for high values of the infection rate and disease incidence. In this system, the disease rises as the rate of infection rises, when β < 10.
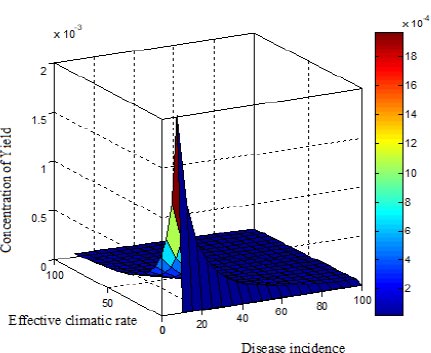
Regardless, when the yield is in a constant quantity, the sickness incidence is quite high, as shown in Fig. (8).
We can infer that when both the seasonality index and disease incidence marginally decline, the yield rises. Table 2 compares simulation findings with analytical expressions of climate, illness, and yield. In the created model, the analytical solution contributed to 0.2832%, and numerical simulations have obtained the maximum relative error. The generated model has also been subjected to a parametric Jacobian transformation stability study. It is advised to utilise the created model (Eq. 5-7) to calculate the yield of the grapes based on the results of the mathematical experiments that have been conducted. Furthermore, the algebraic approach can be used to forecast or consider both linear and non-linear systems.
| t | Climate Disease Yield | ||||||||
|---|---|---|---|---|---|---|---|---|---|
| c(t) | d(t) | y(t) | |||||||
| This work | Simulation | Error % | This work | Simulation | Error % | This work | Simulation | Error % | |
| 0 | 28.0000 | 28.0000 | 0.0000 | 0.0000 | 0.0000 | 0.0000 | 0.0000 | 0.0000 | 0.0000 |
| 0.1 | 0.00311 | 0.00312 | 0.3215 | 1.6140 | 1.6150 | 0.0620 | 26.3900 | 26.3800 | 0.0379 |
| 0.2 | 0.1473 | 0.1475 | 0.1358 | 0.1473 | 0.1476 | 0.2037 | 27.8500 | 27.8501 | 0.0004 |
| 0.3 | 0.0120 | 0.0121 | 0.8333 | 0.0121 | 0.0122 | 0.8264 | 27.9900 | 27.9902 | 0.0007 |
| 0.4 | 0.0052 | 0.0052 | 0.0000 | 0.00521 | 0.0052 | 0.1919 | 28.0000 | 28.0000 | 0.0000 |
| 0.5 | 0.0001 | 0.0001 | 0.0000 | 0.00241 | 0.00242 | 0.4149 | 28.0000 | 28.0000 | 0.0000 |
| Average error % | 0.2151 | Average error % | 0.2832 | Average error % | 0.0065 | ||||
CONCLUSION
Utilising the asymptotic method, the constructed agro-climatic grape production forecast CDY model has been solved (Eq.13). The model has been quantified using the basic seasonality index, infection rate, the removal rate of yield loss, and the analytical expressions of climate, disease, and yield. The acquired results and the numerical result and stability analysis have been found to correspond fairly well. Additionally, the model has been verified using an Android mobile app in a variety of climates. It is advised to apply the created model to estimate grape yield based on the findings obtained. A useful technique for forecasting crop yield a few years in advance has thus been reported in this work.
LIST OF ABBREVIATIONS
| BCA | = Bio-control agent |
| ODEs | = Ordinary differential equations |
CONSENT FOR PUBLICATION
Not applicable.
AVAILABILITY OF DATA AND MATERIALS
The data and supportive information are available within the article.
FUNDING
This work has been supported by Science and Engineering Research Board under MATRICS (SERB - No.: MTR/2019/001221).
CONFLICT OF INTEREST
Dr. J.G. Manjunatha is on the Editorial Advisory Board of The Open Chemical Engineering Journal.
ACKNOWLEDGEMENTS
The authors are grateful to the reviewers for their careful and meticulous reading of the paper. They also express their gratitude to Dr. V. Geethalakshmi, Vice Chancellor, Dr. M. Raveendran, Director of Research, Tamil Nadu Agricultural University, Coimbatore, and Dean (Engg.), Professor and Head, Dept. of PS&IT, Agricultural Engineering College and Research Institute, TNAU, Coimbatore.