All published articles of this journal are available on ScienceDirect.
Selectivity Modeling of Synthesis Gas Reaction over the Iron Catalyst and Optimization Products
Abstract
Background:
Among all of the consumable energy, the liquid fuel is very important. The use of the various technologies to produce this expensive material will be increasing day by day.
Materials & Methods:
The Fischer-Tropsch Process is one of these technologies. In this catalytic process, a lot of products are produced, therefore, it is always steered to the production of favorable products. For this reason, in order to predict the performance of iron-based catalysts, based on the three factors;pressure, temperature and H2/CO ratio, the selectivity models for the products were obtained. Then, the best possible conditions for the highest production of hydrocarbons were calculated which are used in the designing of engineering equipment.
Result & Conclusion:
The optimal condition for the maximum production of total hydrocarbons achieved was set as P=1 MPa, H2/CO=1, and T=542 K.
1. INTRODUCTION
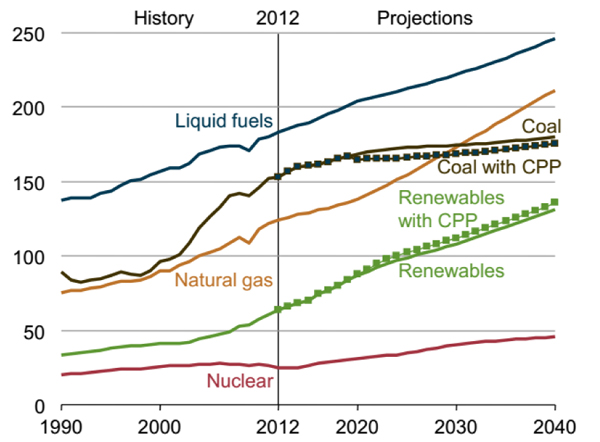
Energy Outlook 2016 predicted that the liquid fuel consumption will increase by more than 34% between 2012 and 2040, the majority of which will be spent on transportation and industry [1]. The liquid fuel consumption is in the first place, as shown in Fig. (1). Therefore, the production of liquid fuel is considered important for the chemical industry. One of the processes of producing liquid fuels are the Fischer-Tropsch (FT) process. The Fischer-Tropsch synthesis is an important technology that, through various reactions, converts synthesis gas (CO, CO2, H2) into liquid fuels, such as gasoline and diesel [2-5]. The production of different hydrocarbons in the FT process is affordable in the presence of both iron and cobalt catalysts [6]. The cobalt catalyst is often suitable for synthesis gas derived from natural gas. This catalyst at high temperatures mainly produces methane, which exhibits poor performance for the Water Gas Shift reaction (WGS) [7, 8]. While the iron-based catalyst is observed to have a more suitable activity for synthesis gas produced from coal and biomass. It also produces a wide range of products at different temperatures and prevents the accumulation of carbon on its surface by using the WGS, thus it will deactivate later [9-11].
1.1. Mechanism of the Iron Catalyst Preparation
Before of the FT process, the catalysts are reduced to hydrogen or H2/CO ratio. Due to the complexity of catalytic systems, the microscopic understanding of the effects of catalyst reduction on iron-based catalysts is a great help in evaluating the activity of this catalyst. In the H2 atmosphere, in both locations, the surface and volume of the iron-based catalyst, initially the hematite phases (Fe2O3) are converted into magnetite phases (Fe3O4), this is possible even at low temperatures and within two hours. Then, proportional to the support used, the Fe3O4 shape changes to a FeO that has a semi-stable shape. FeO is reduced to α-Fe at the catalyst level and volume. The recovered iron phases (Fe3O4, FeO and α-Fe), in the presence of CO or synthesis gas, are converted slowly into the iron carbide phase. It should be kept in mind that magnetite and hematite are not the catalytic active phases, but converting them into carbide is a prerequisite for the FT activity. The carbonization power of the reduction iron species is α-Fe> FeO> Fe3O4. With the gradual carburization of the recovered iron phases, hydrocarbon species are formed on the catalyst slowly. As a result, it could be seen that iron carbide formed on the surface layers plays a positive role in relation to active sites in FT [12, 13].
1.2. The Function of Iron Catalyst in Different Operating Condition
Temperature, pressure and H2/CO ratio are three effective factors in the process of producing hydrocarbon derivatives in FT synthesis [14] and their increase and decrease have a serious impact on the degree of selectivity of the products. Table 1 [15-27] describes the investigations were performed by researchers in various operating conditions. However, none of these studies provided a comprehensive model for predicting the performance of iron-based catalyst under the three factors; temperature, pressure and H2/CO ratio.
| Catalyst Type | Condition Reaction | Reference | ||
|---|---|---|---|---|
| T [K] | P [MPa] | H2/CO Ratio | ||
| Iron based catalyst | 493-523 | 0.79-2.96 | 0.67-1.06 | (Zimmerman and Bukur,1990) [15] |
| 533-573 | 1.1-2.61 | 0.67-2.05 | (Teng et al., 2006) [16] | |
| 513–553 | 1.0 -2.85 | 0.4–1.0 | (Hayakawa et al., 2007) [17] | |
| 553-723 | 0.1-1.5 | 1-3 | (Mirzaei et al., 2009) [18] | |
| 513-573 | 1-3 | 1-5 | (Tian et al., 2010) [19] | |
| 543-573 | 0.61-2.2 | 1.5-2 | (Atashi et al., 2011) [20] | |
| 563-593 | 0.1-1 | 1-3 | (Arsalanfar et al., 2012) [21] | |
| 523–573 | 0.2-1 | 2 | (Mirzaei et al., 2012) [22] | |
| 538 | 0.5 | 0.25,1,4 | (Ding et al., 2013) [23] | |
| 553-653 | 1-2.1 | 0.1-1.2 | (Fazlollahi et al., n.d.) [24] | |
| 513–543 | 0.1–1.2 | 1, 1.5, 2 | (Sarkari et al., 2014) [24] | |
| 493-533 | 0.8-2.5 | 0.67-2 | (Olewski et al., 2015) [25] | |
| 493,513,533 | 0.8, 1.5, 2.25, 2.5 | 0.67, 2 | (Todic et al., 2016) [26] | |
| 543-613 | 0.12-0.7 | 0.5-2 | (Golestan et al., 2017) [27] | |
1.3. Necessity of the Research
As stated, in the FT process, the production rates are different by the change in temperature, pressure and H2/CO ratio. Therefore, several experiments must be carried out to achieve the conditions that most of the production of the favorable product is achieved at a temperature, pressure and H2/CO ratio of process being essential for the design of petrochemical equipment, especially in the design of the reactor and all equipment after it, that result in, costs and time will increase. The objective of this study is to achieve optimal conditions for the most production of hydrocarbon products in the synthesis of Fischer-Tropsch under the iron-based catalyst to reduce costs at industrial scale.
2. MATERIALS AND METHODS
2.1. Catalytic Properties
Preparation of the catalyst is presented in the previous study [28]. The diameter and the surface area (BET) of the iron-based catalyst are 0.18-0.25 mm and 11.78 m2/g respectively. 4.01 g of the catalyst was placed inside a fixed bed reactor. The catalyst had been reduced in the temperature of 543K, the pressure of 0.25-0.3 MPa and GHSV=1000 h-1 for 36 hours. Then the catalyst was placed under the reaction condition, the temperature of 450 to 600 K, the pressure of 1-2 MPa and the H2/CO ratio of 1-2.
2.2. Response Surface Methodology (RSM)
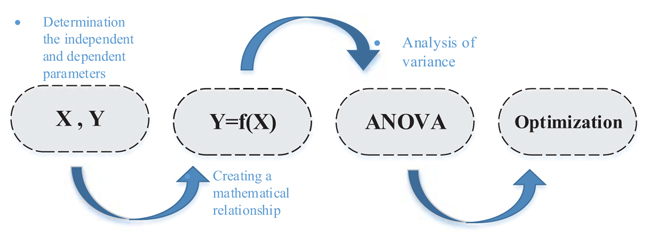
The meaning of optimization is the change of the independent parameters to achieve optimal conditions, so that the value of the dependent variable is optimized. Changes in each parameter require that other parameters be constant, which is why it involves a lot of time and cost. The response surface methodology is used to overcome this problem. The RSM is a set of mathematical relationships that provides a logical relationship between several independent and dependent parameters. Using the obtained relationships, the effect of each independent parameter and their interaction upon the value of the dependent parameter can be observed and the optimal values are obtained. The steps of the RSM are illustrated with Fig. (2) schematically.
After determining the independent and the dependent parameters by applying equation (1), mathematical relations are established.
 |
(1) |
Here, λ 0, λi, λii, λij are constant terms, the coefficients of the linear parameters, and the coefficients of quadratic, denotes the coefficients of the interaction parameters respectively. Y is the dependent variable or response, X is the independent variable and is the fitting error. Then, assessments are made to approve its accuracy. The analysis of Variance (ANOVA) is a collection of mathematical relationships that, with the aid of the R2, R2adj and P-value parameters, validates the model's results. To calculate R2 (the coefficient of determination), Equation (2) is used; if the R2 value is closer to 1, the accuracy of the model will be greater. By increasing the number of experiments, the R2 value is closer to one, as when the dependence of R2 value to the number of experiments is eliminated, Equation (3) (R2adj) is achieved. The R2adj value is also closer to one, the model is more stable. The P-value (probable value) expresses the probability of the placing an answer in the wrong area, and typically, if that is less than 0.05, the model will be meaningful from the statistical point of view.
 |
(2) |
 |
(3) |
y is the empirical response value;
 is the mean of responses,
 the amount calculated by the model. n represents the number of observed responses and p represents the number of variables in the model.
3. RESULTS AND DISCUSSION
The selectivity of Fischer Tropsch process products depend on the reaction conditions. So that the increase or decrease in each parameter (temperature, pressure and H2/CO ratio) will have different results. Similarly, by employing the response surface methodology for the products derived from FT synthesis on the iron-based catalyst under the three factors; temperature, pressure, and H2/CO ratio, the selectivity models are obtained. In here the independent and dependent parameters are presented in Table 2. The general equation for all products is represented with Equation (4), and the constant coefficients for each of the selectivity model are in Table 4. For the correctness and evaluation of the obtained models, Table 3 shows the analysis of variance (ANOVA). In all models, the values of R2 and R2adj are very close to one. The P-value values for all models are less than 0.05, which indicates that the models are statistically significant.
| – | Variable | Symbols | Confine | |
|---|---|---|---|---|
| Min | Max | |||
| Independent | P (MPa) | X1 | 1 | 2 |
| H2/CO | X2 | 1 | 2 | |
| T (K) | X3 | 450 | 600 | |
| Dependent | HC | Y1 | -- | -- |
| C2-C4 | Y2 | -- | -- | |
| C5+ | Y3 | -- | -- | |
| – | Y1 | Y2 | Y3 | |||
|---|---|---|---|---|---|---|
| – | F-value | P-value | F-value | P-value | F-value | P-value |
| Model | 668.8 | < 0.0001 | 2117.41 | < 0.0001 | 2049.91 | < 0.0001 |
| X1 | 8.66 | 0.0091 | 3415.76 | < 0.0001 | 3305.85 | < 0.0001 |
| X1 | 8.66 | 0.0091 | 3415.76 | < 0.0001 | 3305.85 | < 0.0001 |
| X2 | 55.61 | < 0.0001 | 790.15 | < 0.0001 | 781.96 | < 0.0001 |
| X3 | 4889.67 | < 0.0001 | 14693.9 | < 0.0001 | 14208.3 | < 0.0001 |
| X1X2 | 1.75 | 0.2031 | 26.97 | < 0.0001 | 25.89 | < 0.0001 |
| X1X3 | 2.61 | 0.1245 | 1.73 | 0.2055 | 1.62 | 0.22 |
| X2X3 | 23.63 | 0.0001 | 22.84 | 0.0002 | 21.14 | 0.0003 |
| X12 | 1.08 | 0.3125 | 91.58 | < 0.0001 | 89.19 | < 0.0001 |
| X22 | 1.14 | 0.3005 | 4.2 | 0.0561 | 4.31 | 0.0534 |
| X32 | 577.55 | < 0.0001 | 98.28 | < 0.0001 | 92.5 | < 0.0001 |
| – | R2 = 0.9972 | R2=0.9991 | R2=0.9991 | |||
| R2Adj= 0.9957 | R2Adj=0.9986 | R2Adj=0.9986 | ||||
| R2Pred=0.9934 | R2Pred=0.9974 | R2Pred=0.9973 | ||||
| Dependent Variables | Independent Variable Coefficients | |||||||||
|---|---|---|---|---|---|---|---|---|---|---|
| λ 0 | λ1 | λ2 | λ3 | λ4 | λ5 | λ6 | λ7 | λ8 | λ9 | |
| Y1 | 96.64 | 0.32 | -0.80 | -7.48 | 0.17 | 0.21 | -0.63 | 0.19 | 0.2 | -4.67 |
| Y2 | 22.47 | -1.61 | -0.77 | 3.32 | 0.17 | -0.044 | -0.16 | 0.45 | 0.097 | -0.49 |
| Y3 | 77.26 | 1.60 | 0.78 | -3.32 | -0.17 | 0.043 | 0.16 | -0.45 | -0.10 | 0.49 |
 |
(4) |
3.1. The Selectivity Model of Hydrocarbons (HC)
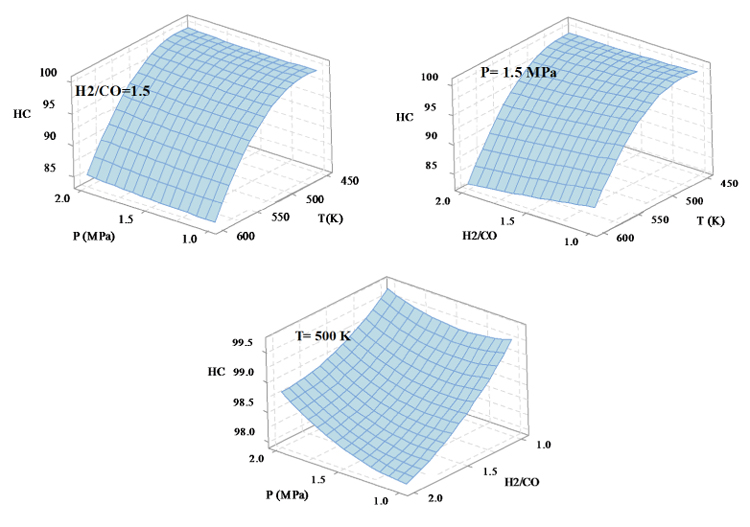
The selectivity variations of total hydrocarbons (HC) with temperature, pressure and H2/CO ratios are shown in Fig. (3). The temperature is more effective than the two pressure and H2/CO ratio factors on the selectivity of the total hydrocarbons, so that, with the increasing temperature, the selectivity of HC decreases. The pressure factor has the least effect on the selectivity of total hydrocarbon, therefore, by increasing it the total hydrocarbon selectivity increases. The selectivity of total hydrocarbons with the H2/CO ratio has the reverse relation so that with increasing the amount of H2/CO ratio the selectivity of HC decreases and vice versa. To obtain the highest selectivity of HC, the reaction conditions must be set to P=1 MPa, H2/CO=1, T=468 K.
3.2. The Selectivity Model of Light Hydrocarbon (C2-C4)
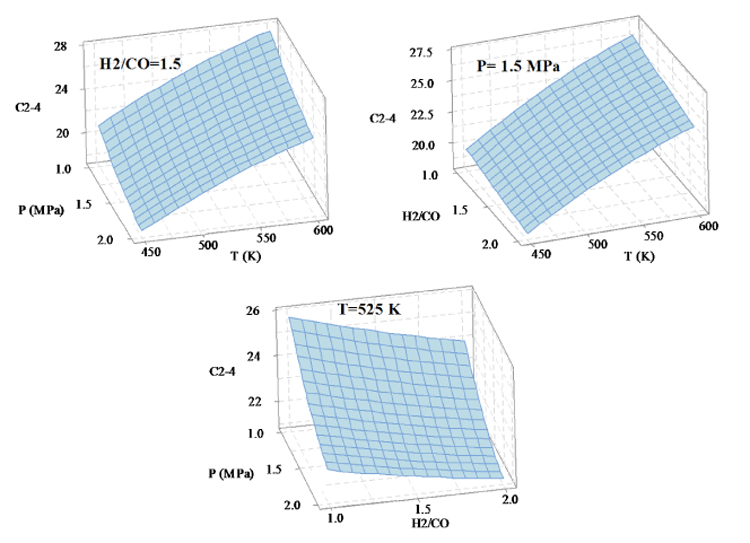
Figure 4 shows how the three factors of temperature, pressure and H2/CO ratio influence the selectivity variations of light hydrocarbons. The images show that the temperature has the most impact on the selectivity of C2-C4, such that the selectivity of light hydrocarbons increases by increasing the temperature, however, with increasing P and H2/CO ratio, the selectivity of C2-C4 decreases. In order to obtain the highest hydrocarbon production, the reaction conditions shall be T=600 K, P=1 MPa, H2/CO=1.
3.3. The Selectivity Model of Heavy Hydrocarbons (C5 +)
The C5+ selectivity changes with the three factors; temperature, pressure and H2/CO ratio are shown in Fig. (5). Increasing temperature, pressure and H2/CO ratio result in the reducing, increasing and increasing in the selectivity of heavy hydrocarbons, respectively. In the optimization section, if the goal is to minimize the production of heavy hydrocarbons, the reaction conditions will be set to T=600 K, P=1 MPa, H2/CO=1.
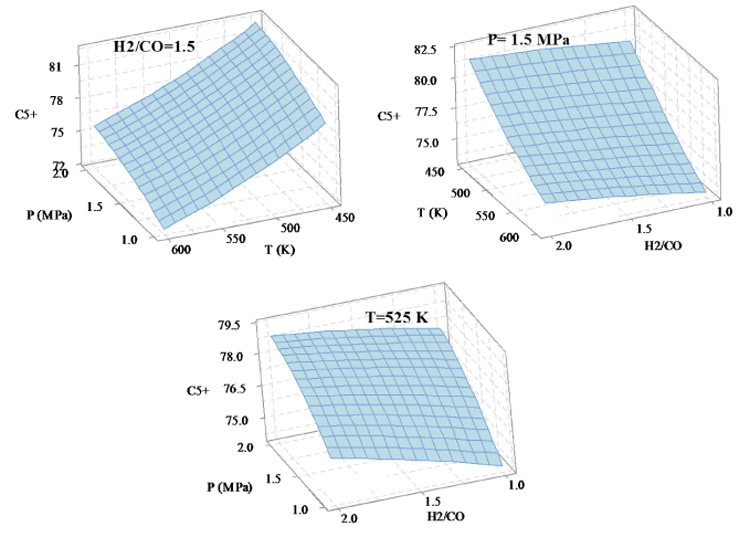
Table 5 summarizes the amount of laboratory matching with output data of the selectivity models, clearly highlighting that the RSM is efficient. Also, since the R2-Perd value is closer to 1, we can use the models to predict the products selectivity in different values of temperature, pressure and H2/CO ratio. For example, in the reference [29], the total selectivity of hydrocarbons on the catalyst 50% Fe/50%Mn/6%K at P=1atm, H2/CO=2, T=250°C was obtained to be 94.5, which in the model was obtained in this study with less than 2% difference, being 96.38.
| P (MPa) | H2/CO | T (K) | Experimental | Calculated | ||||
|---|---|---|---|---|---|---|---|---|
| HC | C2-C4 | C5+ | HC | C2-C4 | C5+ | |||
| 1.0 | 1.0 | 450 | 99.89 | 21.86 | 78.11 | 100.08 | 21.76 | 78.07 |
| 1.0 | 1.0 | 510 | 98.82 | 25.16 | 74.83 | 98.90 | 25.03 | 74.77 |
| 1.0 | 1.0 | 600 | 86.37 | 28.91 | 71.08 | 85.93 | 28.75 | 70.98 |
| 1.0 | 1.5 | 450 | 99.68 | 20.81 | 79.18 | 99.54 | 20.87 | 78.97 |
| 1.0 | 1.5 | 510 | 97.61 | 24.04 | 75.96 | 97.85 | 24.02 | 75.79 |
| 1.0 | 1.5 | 600 | 83.87 | 27.79 | 72.21 | 84.12 | 27.55 | 72.19 |
| 1.0 | 2.0 | 450 | 99.52 | 20.25 | 79.75 | 99.40 | 20.18 | 79.67 |
| 1.0 | 2.0 | 510 | 97.29 | 23.44 | 76.56 | 97.21 | 23.20 | 76.62 |
| 1.0 | 2.0 | 600 | 82.85 | 26.45 | 73.55 | 82.72 | 26.54 | 73.20 |
| 1.5 | 1.0 | 450 | 99.89 | 19.67 | 80.30 | 99.82 | 19.57 | 80.26 |
| 1.5 | 1.0 | 510 | 98.82 | 22.81 | 77.19 | 98.81 | 22.80 | 76.99 |
| 1.5 | 1.0 | 600 | 86.44 | 26.47 | 73.52 | 86.09 | 26.47 | 73.26 |
| 1.5 | 1.5 | 450 | 99.68 | 18.87 | 81.12 | 99.46 | 18.86 | 80.99 |
| 1.5 | 1.5 | 510 | 97.64 | 21.98 | 78.02 | 97.94 | 21.97 | 77.85 |
| 1.5 | 1.5 | 600 | 84.14 | 25.67 | 74.32 | 84.46 | 25.44 | 74.30 |
| 1.5 | 2.0 | 450 | 99.55 | 18.48 | 81.52 | 99.49 | 18.34 | 81.51 |
| 1.5 | 2.0 | 510 | 97.46 | 21.51 | 78.49 | 97.46 | 21.32 | 78.50 |
| 1.5 | 2.0 | 600 | 83.26 | 24.74 | 75.26 | 83.22 | 24.61 | 75.13 |
| 2.0 | 1.0 | 450 | 99.89 | 18.48 | 81.49 | 99.95 | 18.29 | 81.54 |
| 2.0 | 1.0 | 510 | 98.82 | 21.51 | 78.48 | 99.11 | 21.49 | 78.31 |
| 2.0 | 1.0 | 600 | 86.51 | 25.20 | 74.78 | 86.64 | 25.10 | 74.63 |
| 2.0 | 1.5 | 450 | 99.70 | 17.84 | 82.15 | 99.76 | 17.75 | 82.09 |
| 2.0 | 1.5 | 510 | 99.77 | 20.84 | 79.15 | 98.41 | 20.83 | 78.99 |
| 2.0 | 1.5 | 600 | 84.76 | 24.50 | 75.50 | 85.18 | 24.25 | 75.49 |
| 2.0 | 2.0 | 450 | 99.60 | 17.36 | 82.64 | 99.96 | 17.41 | 82.44 |
| 2.0 | 2.0 | 510 | 97.66 | 20.49 | 79.51 | 98.11 | 20.36 | 79.46 |
| 2.0 | 2.0 | 600 | 84.62 | 23.64 | 76.36 | 84.12 | 23.59 | 76.15 |
CONCLUSION
Increasing consumption of liquid fuel, especially in transportation and industry sectors, has caused serious concerns. The use of the Fischer-Tropsch technology somewhat reduces concerns about the lack of liquid fuel production. The Fischer-Tropsch synthesis produces a type of liquid fuels to apply the iron-based catalyst and as well as the renewable materials such as wood and coal waste . The variety of products obtained is influenced with the conditions applied in the process, therefore, for producing the most favorable product, the optimum conditions must be obtained. For this purpose, in this study, using the mathematical method, the performance of iron-based catalyst based on three factors of temperature, pressure and H2/CO ratio was obtained and presented in the form of selectivity equations. Then, it was found that the temperature has a greater effect on the product selectivity than the two factors of pressure and H2/CO ratio. Therefore, with an increase in the temperature, the selectivity of HC and C2-C4 increases significantly and the C5 + selectivity decreases. Then, in each section, the optimal conditions for the product selectivity were expressed. Finally, if target is the maximum production hydrocarbons, light hydrocarbons and heavy hydrocarbons, the optimal conditions will be set to P=1 MPa, H2/CO=1, T=542 K.
SYMBOLS
| σ | = The fitting error |
| λ | = Constant terms |
LETTERS
| A | = Kinetic parameter |
| i | = Counter |
| j | = Counter |
| n | = The number of input data |
| P | = Reduction pressure (Mpa) |
| p | = The total number of explanatory variables in the model |
| R2 | = The coefficient of determination |
| R2adj | = Adjusted R2 |
| SSError | = The squared residuals with respect to the linear regression |
| SSTotal | = The squared residuals with respect to the average value |
| T | = Temperature (K) |
| X | = The independent variables |
| Y | = The dependent variables |
| y | = The empirical response value |
| ȳ | = The mean of responses |
| ŷ | = The amount calculated by the model |
LIST OF ABBREVIATIONS
| ANOVA | = Analysis Of Variance |
| BET Brunauer | = Emmett–Teller |
| FT | = Fischer-Tropsch |
| GHSV | = Gas Hourly Space Velocity (h-1) |
| RSM | = Response Surface Methodology |
| WGS | = Water Gas Shift |
CONSENT FOR PUBLICATION
Not applicable.
CONFLICT OF INTEREST
The authors declare no conflict of interest, financial or otherwise.
ACKNOWLEDGEMENTS
The authors gratefully acknowledge Iran's Ministry of Science and Research and University of Sistan and Baluchestan for helping and financial supporting this research.

