All published articles of this journal are available on ScienceDirect.
Computational Simulation of Atherosclerosis Progression Associated with Blood Pressure in a 2-D Idealized Human Carotid Artery Model
Abstract
Introduction:
Cardiovascular diseases are a known health threat with no respect for age. The need to understand the initiation and progress of the disease is expedient in proper diagnosis and management of the disease.
Objective:
The work is targeted at simulating the effect of elevated blood pressure on the initiation and development of plaque over time concerning wall shear stress, WSS and plaque wall stress, and PWS.
Methods:
Conditions such as blood velocity, pressure, and arterial wall conditions associated with blood flow in arteries, as well as patient-specific characterization related to these variables and conditions, were plugged into modified models in the COMSOL multiphysics software. The artery was modeled as an idealized 2-D carotid artery model.
Results:
Results showed that the WSS distribution with respect to changes with a blood pressure of 500 Pa gave the highest WSS value at the plaque neck and 1500 Pa gave the highest WSS value in the regions close to the plaque root. It was also observed that as the plaque size increased, the region experiencing severely high values for WSS also expanded.
Conclusion:
It can be recommended that blood pressure monitoring is necessary to curb the attendant cardiovascular diseases associated with high blood pressure.
1. INTRODUCTION
As of 2010, statistics showed that the probability of dying from a CVD is about 30%, indicating that fatalities from other diseases such as cancers are relatively insignificant [1]. He & Chen (2018) [2] showed that as of 2002, the World Health Organisation (WHO) had recognized cardiovascular diseases (CVDs) as an epidemic and concluded that efforts to combat the diseases had been a collateral failure. One of the reasons for this failure was a lack of adequate knowledge of the disease and the implementation of scientific solutions. Unfortunately, the younger population is not an exception to the risk of this disease. Studies by Wang et al. (2017) [3] indicated that CVDs amongst the populace of ages < 45 years between 2010 and 2014 increased significantly. In the light of the current SARS-CoV-2 pandemic, CVDs are known to be the second-highest comorbidity that has led to deaths in recent times [4].
Atherosclerosis, caused by the clogging or hardening of the arteries induced by plaques, is a common cause of cerebrovascular and coronary diseases, which are the major morbidities worldwide [5]. Over time, as research on the disease broadened, understanding of atherosclerosis has developed from the disease being caused by a plain accumulation of lipids within the innermost layer of the arterial wall [6] to being caused as a condition as an inflammatory response of the body resulting from lipid build-up which is usually initiated by the immune response of the body [7, 8]. When this occurs, there are two possible outcomes: the first is a hemorrhage into the plaque, and the second occurrence could be when blood clot forms on the plaque's surface (thrombus) [9]. This can occur in large and medium-sized arteries and could result in a crisis involving a stroke or heart attack, as the case may be [9].
The work of Vasava et al. (2012) [10] showed the effect of hypo- and hypertension by indicating that variations of blood pressure in a 3-D branched human aortic arch affect WSS distribution. The authors were able to show how hypertensive patients were at higher risk of atherogenesis due to low WSS distribution relative to hypotension. However, the work did not reveal how much these variations in blood pressure would affect the geometrical adaptation of the plaque in terms of the degree of stenosis. Liu & Tang (2010) [11] studied the three-dimensional mathematical model to investigate the geometrical adaptation of the atherosclerotic plaques in coronary arteries and study the influence of inlet flowrate, wall shear stress, and blood viscosity on the growth of atherosclerotic plaque. The authors implemented a linear plaque growth function that involved only the effect of WSS on the adaptation of the plaque over time and also assumed arterial wall rigidity. The work did not include the impact of principal stress of the plaque on the plaque geometry adaptation; also, the assumption of wall rigidity on the effect of plaque adaptation was neglected. Tian et al. (2013) [12] studied the impact of plaque geometry (in terms of height or width), blood pulsatile flow characteristics, Newtonian and Non-Newtonian blood flow characteristics on wall shear stress (WSS), wall shear stress gradient (WSSG) and wall-normal stress (WNS) distribution along a model 2-D blood vessel. The study was able to show the importance of plaque height on WSS distribution as against the width of the plaque, especially with Newtonian blood rheology. The area of interest the study downplayed was how vessel elasticity would affect these variables and their effects on plaque geometrical adaptation.
Alan et al. (2003) [1] studied the relationship between intima thickness, vessel distensibility age, and blood pressure in the coronary artery through non-invasive coronary angiography. They were able to show that in medium to large arteries, intima thickening (associated with plaque growth) affected the distensibility of the vessel considerably, so also they were able to show that blood pressure also affected vessel distensibility considerably. They realized that blood pressure (hypertension) was correlated highly with intima thickening. Their work highlighted the importance of deformability of the blood vessel on blood pressure and plaque development. (Veller et al., 1993) [13] also observed that there was a positive relationship between systolic blood pressure in their non-invasive angiography studies of the common carotid artery, although they didn't tell by how much these variations can affect intima thickening [14-16] also confirmed the importance of blood pressure on intima thickening. The FDA approved blood pressure as a biomarker [17], with systolic pressure seeming to be one of the most critical factors that affect intima thickening.
The implications of hemodynamic properties such as wall shear stress (WSS) on the pathogenesis of atherosclerosis have been studied extensively by works showing various connections between the two variables [11, 18, 19]. These works indicated a strong relationship between WSS and intima thickening, and a negative correlation was recorded in most cases. The work of Tang et al. (2008) [20] also gave insight as to how the normal stress on plaque (Plaque Wall Stress-PWS) also affects the rate of development of the plaque, and this was also referenced in the work of Dhawan et al., (2010) [18]. These have given insight into the hemodynamic-based pathogenesis of the disease. However, not enough has been done by implementing these correlations to properly understand how much the plaque geometry adaptation would be affected by these variables and how fast this process can occur.
There is a need to model the possible variables and conditions such as blood velocity, pressure, and arterial wall conditions associated with blood flow in arteries, as well as patient-specific characterization associated with these variables and conditions. This would help explain how patients whose arteries conform to these characterizations would influence the initiation and progression of atherosclerosis.
The work aims at simulating the initiation and development of plaque over time, in relation to WSS and PWS, with a focus on the effect of elevated blood pressure on WSS and PWS and its overall impact on the plaque growth rate. The artery of focus here was an idealized 2-D carotid artery model.
2. METHODOLOGY
2.1. Vessel Model and Properties
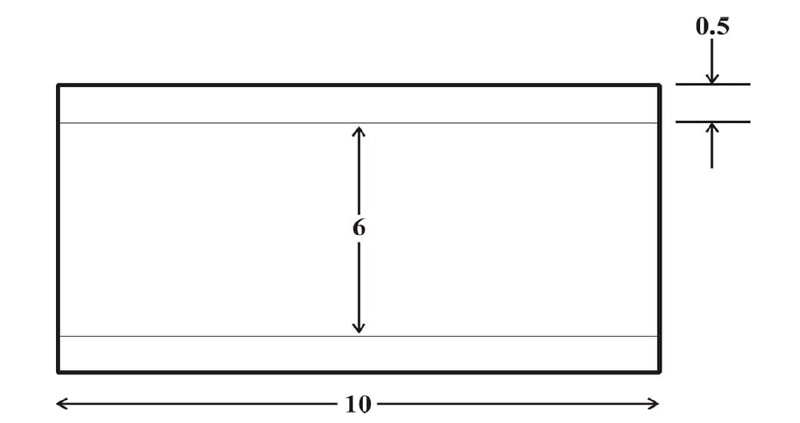
The carotid artery model was a 2-D straight vessel with two domains; the lumen domain and the arterial wall domain. The wall of the artery was considered single-layered, homogenous, isotropic, and incompressible with linear-elastic characteristics [21]. The computational domain for the flow is described in Fig. (1). The dimensions used for the vessel model were adapted from studies [21-24] on the carotid artery with modifications, as indicated in Fig. (1). The vessel characteristics of the carotid artery model are indicated in Tables 1 and 2.
2.2. Blood Properties
Blood was assumed to be Newtonian, incompressible, and viscous when carrying out WSS studies in nature under the arterial conditions being studied [25]. Under the conditions studied, blood flow rheology was taken to be laminar due to Reynolds number values less than 2300; hence the consideration of turbulence was unnecessary. The blood parameters are assumed to be constant all through the flow process, and the absence of an underlying risk factor was also made.
| S/N | Parameter | Value | Source |
|---|---|---|---|
| 1 | Youngs Modulus | 0.9 MPa | (Kumar et al., 2020) [21] |
| 2 | Poisson Ratio | 0.45 | (Kumar et al., 2020) [21] |
| 3 | Vessel length | 10 mm | (Saxena et al., 2019) [22] |
| 4 | Vessel Radius | 6 mm | (Saxena et al., 2019) [22] |
| 5 | Vessel Thickness | 0.5 mm | (Kumar et al., 2020; Stein, 2004) [21, 24] |
| 6 | Arterial wall density | 1050 kg/m3 | (Kumar et al., 2020; Razavi et al., 2011) [21, 23] |
2.3. Boundary Conditions
The assumption of the linear elastic arterial wall with parameters as shown in Table 1 was justified because arteries usually experience deformations ranging from 10 – 15% within the cardiac cycle of blood flow [26, 27]. This linear elastic model has also been computationally cost-effective, producing results that correlate satisfactorily with experimental data [28]. The common carotid artery is the section under investigation, and this section was constrained at the edges of the arterial wall to ensure the stability of the model during flow as well as a more realistic representation of the working of the artery (Kumar et al., 2020). However, the remaining nodes were set to be free to ensure fluid-structure interaction between the blood in the arterial lumen and the artery wall [20, 21, 29]. A fully developed Inlet velocity boundary condition was applied at the inlet of the artery, and a traction boundary pressure condition was applied at the outlet of the artery [11, 22, 30]. For simplicity and to save simulation time, it was assumed that the outlet pressure of the artery is the mean outlet pressure throughout the cardiac cycle and assumed to be constant throughout. The flow of blood at the artery wall was also assumed to experience a no-slip condition during the cardiac cycle. The velocity distribution along the vessel cross-section is defined by equations (1) to (3), where equation (4) is the zero-traction, zero-pressure boundary outlet condition.
 |
(1) |
 |
(2) |
Where vin represents the inlet velocity, and the artery's distribution is represented by the steady, fully developed velocity profile u(r), where umax is the maximum velocity, at the centre of the artery.
 |
(3) |
Where vR is the velocity at the arterial wall boundary, which indicates a no-slip condition of zero-velocity condition.
 |
(4) |
Where Pout is the outlet boundary condition at the set pressure.
2.4. Model Equation and Computational Set-up
The flow in the arterial model was taken as a fluid-solid interaction (FSI) system consisting of the solid and liquid domain in connection interacting simultaneously. The Navier-Stokes equation for incompressible flow was used to model the blood flow in the artery (Eqs 5 and 6):
 |
(5) |
 |
(6) |
Where ρƒ is the density of the blood v is the velocity field of the blood. Blood flow is described by the velocity and pressure field of the blood in the artery. Other external forces associated with gravity and movement of the human body are considered negligible hence they have been eliminated from the model. σƒ is the stress tensor and is represented by a function of pressure and velocity field of blood (Eq 7);
 |
(7) |
Where μ is the blood viscosity, pf is the Lagrange multiplier corresponding incompressibility constraint in equation 5, ε(vf) is the strain-rate tensor (Eq 8):
 |
(8) |
Where τij is the shear stress, γij is the shear rate.
For the arterial wall structure, the model governing deformation in the structure is (Eq 9);
 |
(9) |
Where s is the solid structure (arterial wall), ρs is the arterial density, g is the conglomerate of external body forces acting in the arterial wall, taken to be = 0, σs is the Cauchy stress tensor. With respect to a fixed reference state (Eq 10);
 |
(10) |
Where us is the vessel wall displacement  is the first Piola-Kirchoff tensor which represents the momentum equation (12). It is taken that the forces within the blood in the lumen also act on the lumen in an equal but opposite manner such that at the interface between the arterial wall blood in the lumen (Eq 11);
 |
(11) |
Where n is the normal unit vector to the interface Γt0
2.5. Mesh Independent Study
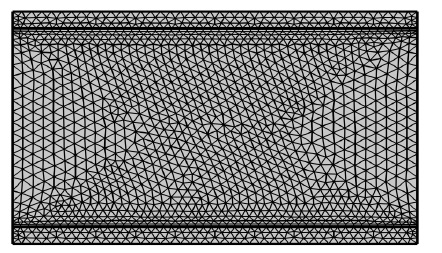
Triangular meshes were used in descretizing the domain of the artery, as indicated in Fig. (2). The meshing was adapted to be more intricate around the boundaries and the wall/blood interface to ensure that the interactions between both domains at the shear rates are accurately computed. The meshing was set to be fine because of optimal result accuracy and computational cost.
2.6. Plaque Growth Modeling
The plaque geometry was idealized, initiated, and made to progress at the centre length of the artery (5 mm), where the growth was extended from the arterial wall as the plaque progressed. The growth was taken to be an asymmetric blockage in the artery.
The plaque initiation and development model equation was based on the model developed by Tang et al. (2008) [20]. The model incorporates the negative correlation between the human carotid plaque progression (WTI) with plaque wall stress (PWS-σ) and flows shear stress (WSS-τ) from in-vivo MRI-based studies. The uniqueness of the model is that, unlike earlier similar models that could not predict plaque initiation and growth at high shear stress (WSS) exposure, the authors extended the model further and discovered that there is still a relationship between plaque growth and the principal shear stress the plaque is exposed to (PWS). This model gave a new dimension to the initial model by incorporating a plaque wall stress (PWS) expression such that the linear function is expressed as:
Where σ is the principal shear stress represented as PWS in KPa, τ is the flow shear stress represented as the WSS in Dyne/ cm2, and WTI is the increase in plaque wall thickness, depicting the differential increase in plaque height relative to the initial plaque height in cm. This model predicts the height the plaque would have attained relative to the initial height every 304 days; hence it is assumed that 1 time /cycle of geometry update is 304 days (Eq 12);
 |
(12) |
2.7. Simulation Steps
The protocol for implementing the model was adopted with modification from the work of Liu & Tang (2010) [11]. There are two major stages involved;
a) Initiation Stage: here, the plaque is initiated in the plaque-free artery. The protocol is such that;
i The initial arterial domain without atherosclerosis (plaque-free) is first considered, and the blood flow under the subjected conditions is solved.
ii The WSS and PWS values are obtained at the point of plaque initiation.
iii The WSS and PWS values are simultaneously inputted into the model to calculate the WTI.
iv Based on the WTI, the plaque is freshly initiated by adjusting the boundary of the arterial wall at the point of stenosis.
b Progression Stage: here, the plaque progresses relative to the memory of the initial plaque condition.
i After the arterial wall boundary has been adjusted to suit the plaque initiation, The fluid-structure interaction (FSI) model is solved again to obtain the WSS and PWS.
ii The PWS and WSS values were simultaneously inputted into the model to calculate the WTI.
iii The new height of the plaque was adjusted by adding the new WTI value.
iv The sequence was repeated until the target time of exposure (after a couple of years of geometry update) was reached.
After each geometry update, the plaque height is increased. Hence stenosis becomes severe. The degree of stenosis/stenosis severity measures the amount of the arterial lumen that has been occluded (in terms of luminal diameter) by the plaque. It restricts blood flow in the axial direction. Here, stenosis measures the degree of the progression of atherosclerosis in the carotid artery. This can be calculated as shown in Eq (13):
 |
(13) |
3. RESULTS AND DISCUSSION
3.1. Effect of Blood Pressure Variation on WSS and PWS
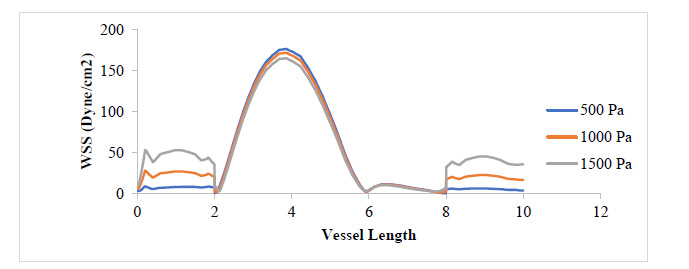
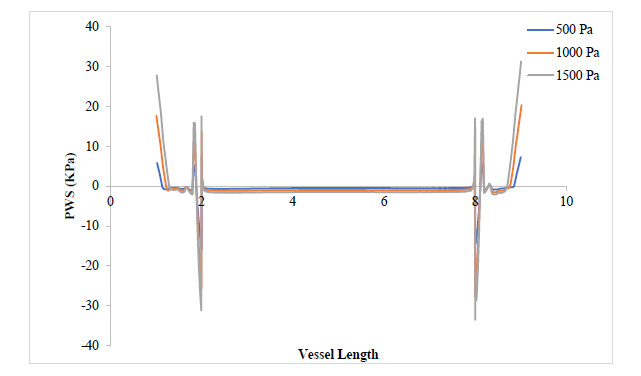
Figs. (3 and 4) show the WSS and PWS distribution along the vessel wall with a plaque after the initiation of the plaque at 17% stenosis at an outlet pressure range from 500 Pa to 1500 Pa, which is meant to mimic the effect of variation of WSS and PWS with blood pressure build-up. It can be observed that in all cases of outlet pressure, the highest WSS and PWS still characteristically occurred at the stenosis neck. Moreover, the root of the plaque characteristically experienced the least WSS and PWS. In a comparison of this distribution for the various outlet pressures considered, it can be seen that the least outlet pressure of 500 Pa gave the highest WSS and PWS at the neck region of the plaque, with the 1500 Pa outlet pressure having the least; however, for regions around the root of the plaque, the reverse is the case. The insight that can be drawn here is that the root of the plaque is the region that is the most structurally vulnerable to rupture. High blood pressure causes high WSS and PWS in these regions, which could be the major reason patients with high blood pressure suffer a higher risk of stroke due to a higher risk of plaque rupture associated with high WSS and PWS values. From Fig. (4), it can be observed that regions close to the neck of the plaque tend to experience compressive stress against regions away or around the root of the plaque, which undergoes tensile stresses.
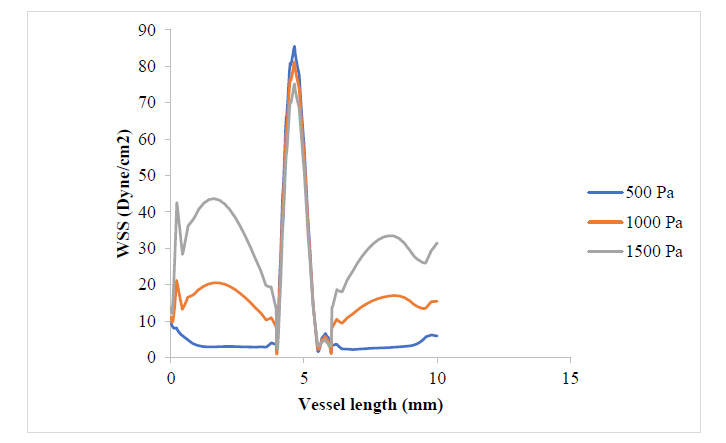
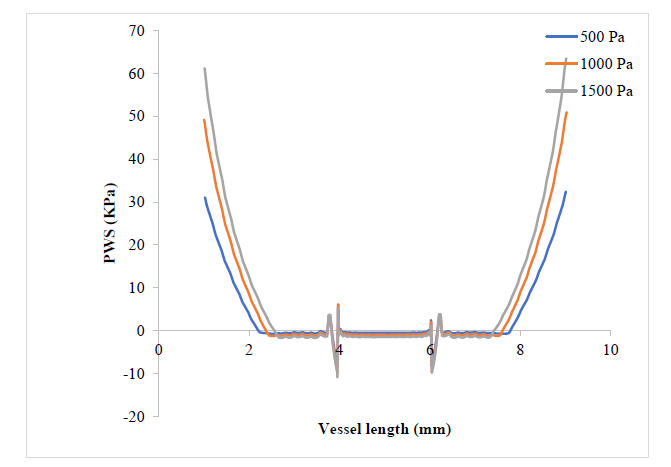
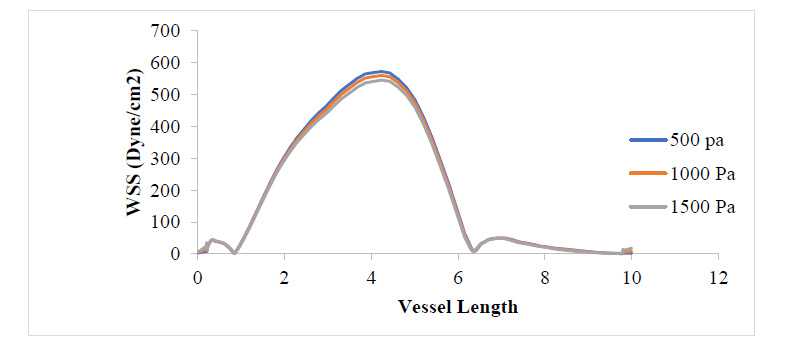
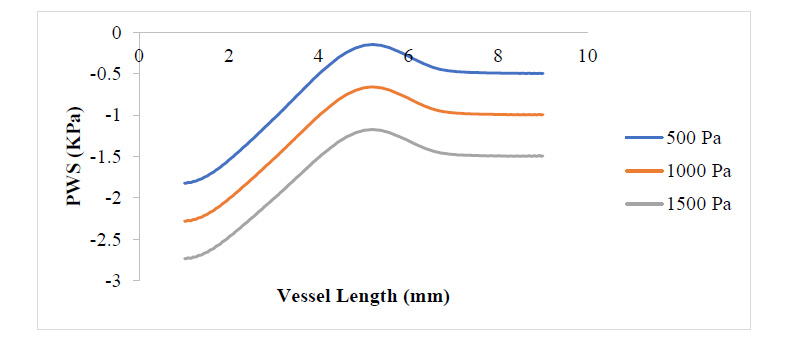
Fig. (4) shows that the WSS has risen to values around twice what it was where the plaque had grown to 17.3% of the vessel diameter. It can be observed that the WSS distribution with respect to changes in blood pressure still follows that 500 Pa gave the highest WSS value at the plaque neck and 1500 Pa gave the highest WSS value at the regions close to the plaque root. It can also be observed that as the plaque size increased, the region experiencing severely high values for WSS also expanded. From Figs. (5 and 6), the WSS and PWS distribution was computed after the plaque had grown to a point the blood vessel lumen diameter had been blocked by half its initial value. Alternatively, comparing Fig. (4) with Fig. (6), there is a stress shift, more from the tensile stress seen in the 17.3% stenosis to more compressive stress as the plaque grew to 50% stenosis, compressional stresses.
From Fig. (7), as the plaque grew to 80% stenosis, maximum WSS has shot up to 7 times the initial value at 17.3% stenosis. The wall of the plaque experienced tremendous WSS, hence indicating that the growth in this region is doubtful. It can also be observed that in regions away from the neck of the stenosis, especially around the arterial wall, pressure variation did not lead to any substantial change in WSS at those regions. Fig. (8) shows a tremendous drop in PWS by about 13 times its initial value when compared to that of the 50% stenosis, so also, no tensile stresses were experienced on the plaque and regions of the arterial wall connected to the plaque. This is because the stresses have been transferred to the inner arterial wall opposite where the plaque is located due to the asymmetrical geometry of the plaque in the vessel.
3.2. Plaque Initiation and Development Associated with Blood Pressure
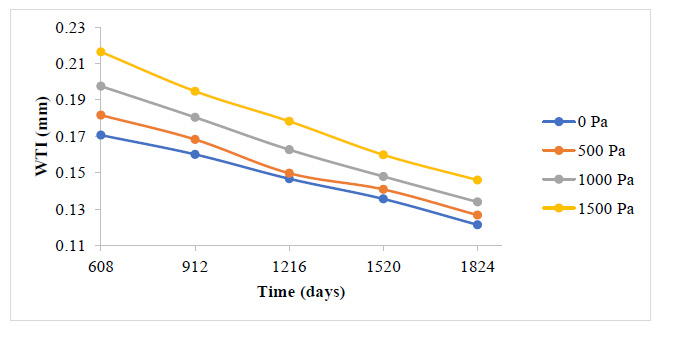
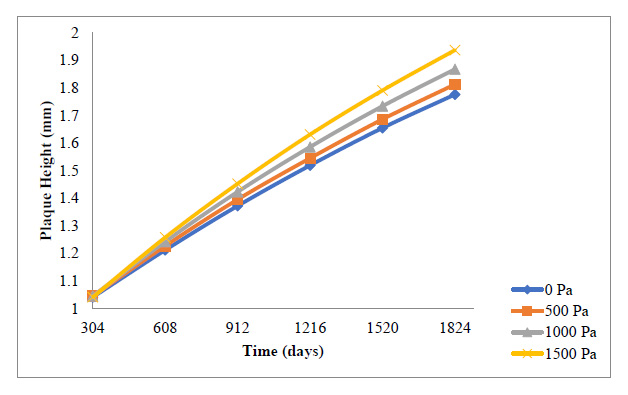
A general reduction in the plaque growth rate as time elapsed is also observed here in Fig. (9 and 10). The essence of this study is to give a holistic insight into how variations in blood pressure would affect the overall plaque height after some time, as well as the rate of plaque growth. Fig. (9) indicates that all through the period studied, the carotid artery experiencing the highest outlet pressure had the highest rate of plaque progression all through. The least outlet pressure had the least rate of plaque growth all through the period studied. This indicates that higher blood pressure tends to give WSS and PWS values that accelerate the rate of development of the plaque in the carotid artery.
Fig. (10) shows the cumulative effect the development rate of the plaque has on the overall plaque height at different outlet pressures. It can be observed that the highest pressure of 1500 Pa gave the highest overall plaque height leading to stenosis of 32.2%, while the least pressure of 0 Pa gave the least overall plaque height leading to vessel stenosis of about 2.95%. Although these variations may not be significant compared to the effect that the blood velocity variations had on the overall plaque height, this gives insight as to how blood pressure too can contribute to the development of a plaque in the carotid artery.
CONCLUSION
It can be concluded that an increase in blood pressure operates such that the WSS and PWS cause a resultant increase in the rate of plaque development and the overall plaque height. As the stenosis increases, the PWS becomes more compressional on the plaque. The results explicitly show the consequence of elevated blood pressure in the carotid artery on the rate of plaque growth and risk of rupture. Blood pressure regulation plays a significant role in the initiation and development of atherosclerosis in the carotid artery and the resultant risk of stroke. It is, therefore, recommended that adequate monitoring of blood pressure be carried out regularly and controlled within limits to prevent the occurrence of atherosclerosis.
CONSENT FOR PUBLICATION
Not applicable.
AVAILABILITY OF DATA AND MATERIALS
Not applicable.
FUNDING
The Team appreciates the financial support of Covenant University in publishing this manuscript and the collaborative support of the Technical University of Munich, Germany.
CONFLICT OF INTEREST
The authors declare no conflict of interest, financial or otherwise.
ACKNOWLEDGEMENTS
The team appreciates the financial support of Covenant University in publishing this manuscript and the collaborative support of the Technical University of Munich, Germany.

