All published articles of this journal are available on ScienceDirect.

Electrochemical Fabrication of Poly (niacin) Modified Graphite Paste Electrode and its Application for the Detection of Riboflavin
Authors Info & Affiliations
Abstract
Objective:
A poly niacin (NN) modified graphite paste electrode was prepared through a simple electrochemical polymerization route for the determination of Riboflavin (RF)
Methods:
Electropolymerization technique was used for the preparation of a modified electrode. The electrochemical impedance spectroscopy (EIS) method was used to study the surface behaviors and conductivity of the bare and modified electrodes. Cyclic voltammetry (CV) and linear sweep voltammetry (LSV) were used to study the electrochemical behavior of RF using 0.2 M PBS of 7.5 pH.
Results:
Poly niacin modified graphite paste electrode (PNNMGPE) provides more affinity towards RF detection with high sensitivity and selectivity over bare graphite paste electrode. RF calibration curve was obtained by LSV between 5.0 µM to 65.0 µM with 0.782 µM limit of detection (LOD) and 2.7608 µM limit of quantification (LOQ), respectively. Selective analysis of RF in the presence of ascorbic acid (AA) and dopamine (DA) was performed at PNNMGPE by the LSV method.
Conclusion:
The developed PNNMGPE was tested for RF analysis in a multivitamin tablet with good results. Furthermore, the developed electrode shows good stability and reproducibility.
1. INTRODUCTION
Riboflavin (RF) or vitamin B2 is used as a dietary supplement and it is a water-soluble B group vitamin, and a a constituent of flavoenzymes [1, 2]. It plays an important role in human biochemistry and metabolism. It is not produced in the human body. It is obtained naturally through a food diet. RF is naturally found in nuts, milk, vegetables and fruits, meat, and eggs. Deficiency of RF in the human body can lead to eye and skin disorders, microcytic hypo-chronic anemia, night blindness (beriberi), pellagra or sometimes even death [3-7]. Also, RF overdose can cause oxidative damage to DNA and tissue by UV radiation exposure [7-11]. So it is important to develop a simple and sensitive analytical method to determine RF.
Existing methods in analyzing RF include chromatography, UV-spectrophotometry, chemiluminescence, Reversed-Phase-High-performance liquid chromatography, spectrofluorimetry, mass spectroscopy, flow injection analysis, Capillary zone electrophoresis, Reversed-Phase Liquid Chromatography, surface plasmon resonance, etc [12-23]; these methods need expensive instruments and complicated procedures. Electroanalytical methods are the best alternatives to the above methods, are relatively cheap and easy but provide excellent analytical performance for the detection of bioactive molecules [24-32]. There are many electroanalysis reports available in the literature for RF estimation such as highly dispersed multi-walled carbon nanotubes coupled manganese salen nanostructure, ZnO/Manganese hexacyanoferrate nanocomposite/glassy carbon electrode, manganese (III) tetraphenyl porphyrin modified carbon paste electrode, poly (3-methyl thiophene) modified glassy carbon electrode, poly deoxy adenylic acid/reduced graphene oxide, DNA-functionalized biosensor and polymer modified carbon paste electrode and some other. Different modified electrodes using amino acids, dyes, nucleotides, neurotransmitters, phenolic compounds, metal nanoparticles, metal complexes, clay, ionic liquids, surfactants, metal oxides, enzymes and DNA modified sensors etc., with different functional groups are widely reported for determination of electroactive species due to their stability, electrocatalytic performance, biocompatibility, antifouling properties, and high applicability [33-44]. Modified electrode controls over potential and improves the sensitivity of sensors. Carbon materials such as graphite, carbon nanotube, graphene, pencil graphite, glassy carbon, activated carbon, and biomass carbon are the best choices for the fabrication of sensors and supercapacitors due to their extensive potential domains, chemical inertness, low ohmic resistance, robustness, mechanical stability, excellent material characteristics, provides lower detection limits with reproducible responses, high surface area, good thermal and electrical conductivity, good anti-causticity, high stability, low cost and commercial-scale availability [45-57]. The present effort describes RF quantification and detection at PNNMGPE using the voltammetry technique.
2. MATERIALS AND METHODS
2.1. Instrumentation
The electrochemical measurements were achieved by CHI-6038E electrochemical workstation (from USA), which consists of a tri electrode arrangement in an electrochemical chamber with a saturated calomel electrode (reference electrode), platinum wire (counter electrode), bare carbon paste electrode (BGPE) and PNNMGPE (working electrode).
2.2. Chemicals and Solutions
RF, NN, AA and DA were bought from Molychem, India. Potassium chloride, silicone oil, and graphite powder were procured from Nice Chemicals, India. Monosodium dihydrogen phosphate, disodium hydrogen phosphate, and potassium ferrocyanide trihydrate were taken from Himedia, India. All the chemicals were of analytical reagent grade and used without additional purification at a laboratory temperature of 298 K.
2.3. Preparation of Electrodes
BGPE was prepared by mixing graphite powder, and silicone oil in the ratio of 70:30 (w/w %) in an agate mortar until the uniform paste was attained. The paste of graphite and silicone oil obtained was packed on a Teflon tube having 3 mm cavity and the surface was softened by polishing on a fresh tissue paper, and the electrical connection was made through a copper wire connected to the graphite paste. PNNMGPE was equipped by the electro-polymerization of 1.0 mM NN on the fresh surface of GPE.
3. RESULTS AND DISCUSSIONS
3.1. Active Surface Area
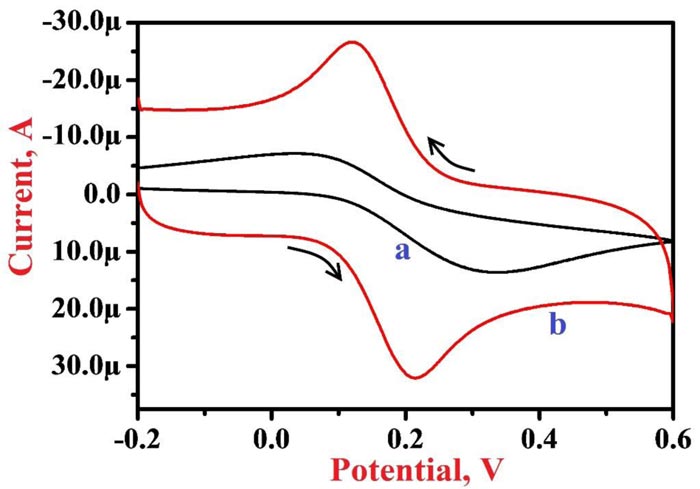
The active surface area of modified and bare electrodes was analyzed by CV method using 1.0 mM K4[Fe(CN)6] in 0.1 M KCl solution as a supporting electrolyte at 0.1 V/s scan rate. Fig. (1) presents cyclic voltammograms (CVs) of 1.0 mM K4[Fe(CN)6] at BGPE (curve a) and PNNMGPE (curve b), here bare electrode depicts a lower peak current of 13.61 µA at the peak potential of 0.332 V with a lower rate of electron migration than PNNMGPE (peak current of 32.07 µA and peak potential of 0.215 V). Therefore, the modified electrode demonstrates a faster rate of reaction, which mainly varies on the active surface area of the electrode and it is determined by the following Randles-Sevcik equation [58];
Ip = 2.69 × 10⁵ n3/2 A D1/2 C v1/2
Where ‘Ip’-peak current, ‘n’-number of electrons involved in the reaction, ‘D’-diffusion coefficient, ‘A’-active surface area of the electrode, ‘υ’-scan rate, and ‘C’-concentration of K4[Fe(CN)6]. The obtained values of the active surface area for BGPE and PNNMGPE were 0.018 cm2 and 0.043 cm2, correspondingly. This result exposes that PNNMGPE promises a suitable platform for the electrochemical analysis of RF with the high sensitivity and fast rate of response.
3.2. EIS Study
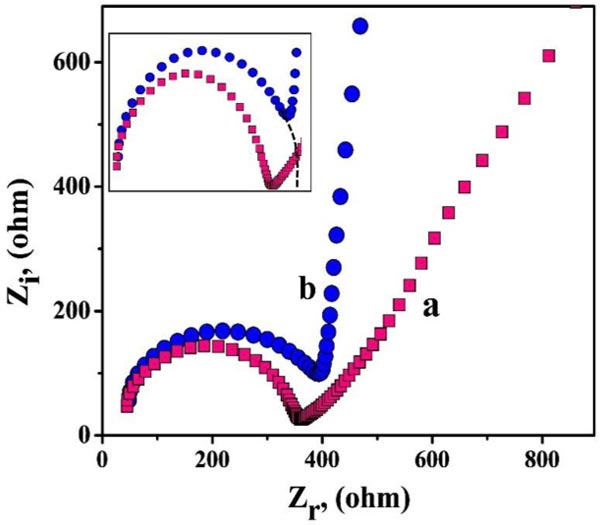
EIS method is advantageous for analyzing the surface behaviors and conductivity of the bare and modified electrodes. Fig. (2) displays the Nyquist plots for PNNMGPE (curve a) and BCPE (curve b). Here, we observed a semi-circular part in both the plots of bare and unmodified electrodes, signifying the charge transfer phenomena and their diameter represents the charge transfer resistance (Rct). The ‘curve a’ and ‘curve b’ represent PNNMGPE and BCPE, with the subsequent Rct values being 90.96 Ω and 355.00 Ω, correspondingly. Here, the modified PNNMGPE provides lesser Rct with high conductivity and faster electron transfer kinetics due to its modification effect [59].
3.3. Electropolymerization of NN on BGPE
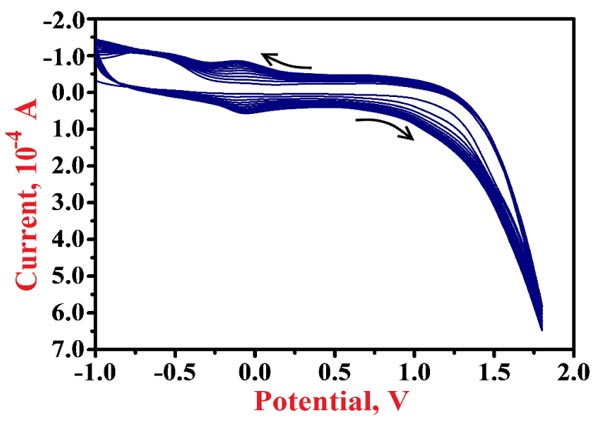
Electropolymerization of NN in 0.2 M PBS of 7.5 pH on the surface of BGPE was done by cycling 10 CV cycles with the potential range of -1.0 V to 1.8 V at 0.1 V/s scan rate. The enrichment of redox peak current of NN for each voltammetric probe was observed as shown in Fig. (3), which shows that the polymer layer is formed on the surface of the bare electrode. After the electrochemical polymerization, the modified electrode was rinsed with deionized water to eliminate the physically adsorbed materials.
3.4. Influence of pH
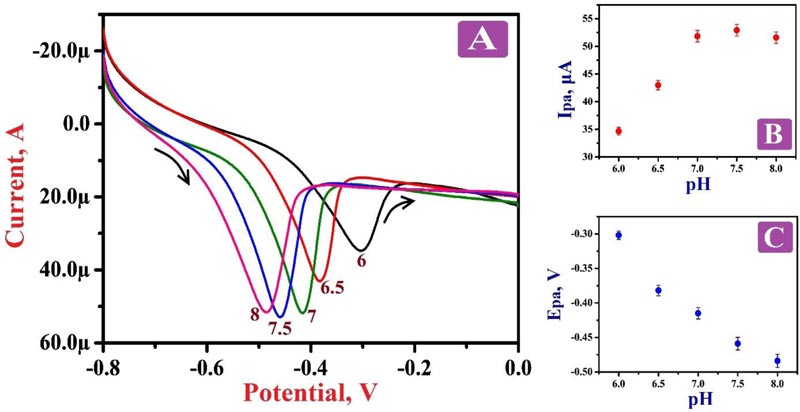
The influence of solution pH on the electro-oxidation of 0.1 mM RF at the surface of PNNMGPE was examined by varying solution pH in the range from 6.0 to 8.0 via LSV at the potential window from 0.6 V to 1.1 V at a scan rate of 0.1 V/s. Fig. (4A) discloses that with the increase of pH, the oxidation potential of RF became more negative. It describes that the oxidation peak potential of RF on the surface of the modified electrode was declining with intensifying pH of the electrolyte with 0.0882 V/pH slope value. Fig. (4B) reveals that the sensitivity of the PNNMGPE was low with lesser oxidation peak current response at the pH of 6.0, 6.5, 7.0 and 8.0, but at 7.5 pH, the sensitivity was very high with high oxidation peak current response. Therefore, 7.5 pH was selected as an optimum pH for this analysis. The plot of oxidation potential against pH was plotted (Fig. 4C), which displayed a decent linear relation with the linear regression equation of Epa (V)=0.209–0.0882 (V/pH) (R2=0.9779), where R2 is the correlation coefficient.
3.5. RF Electrochemical Reaction at BGPE and PNNMGPE
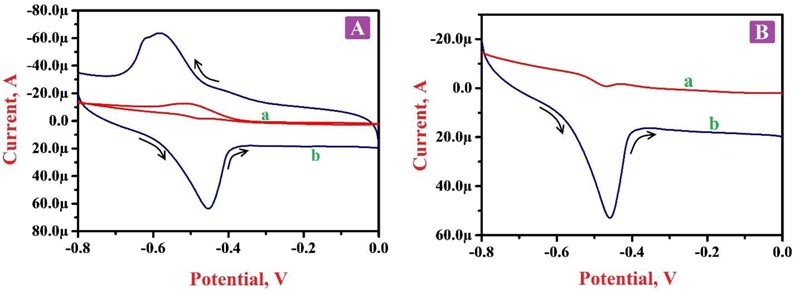
Electrochemical action was deliberated for 0.1 mM RF in 0.2 M PBS of pH 7.5 by CV and LSV approaches at BGPE and PNNMGPE under optimum experimental conditions. Fig. (5A) portrays the cyclic voltammograms (CVs) in the presence of RF molecule in PBS of 7.5 pH on the surface of BGPE (curve a) and PNNMGPE (curve b). Here, ‘curve a’ characterizes the electrochemical action of RF on an unmodified electrode surface, and discloses less sensitive redox peaks at the peak potential of -0.466 V and -0.517 V, respectively. Also, ‘curve b’ denotes the electrochemical behavior of RF at PNNMGPE surface, which delivers more higher anodic and cathodic peaks with the high current response at -0.451 V and -0.583 V than BGPE. From the attained outcomes, the BGPE shows less electron transfer rate and low peak currents with lower catalytic activity. However, PNNMGPE displays a high electron transfer rate and enhanced peak currents with high catalytic action for RF redox nature. The enhancement of redox peak currents at the modified sensor is due to RF interaction with the PNNMGPE surface. RF molecule displays both oxidation and reduction peaks with a change in potential (ΔEp) of 0.132 V, which specifies that the reaction mechanism of RF at PNNMGPE is quasi-reversible. These outcomes clearly clarify that the electrochemical nature of RF predominantly depends on the pH of PBS and PNNMGPE with adequate conductivity, fast electron transfer rate and suitable antifouling nature.
Fig. (5B) characterizes the linear sweep voltammograms (LSVs) of RF in PBS of 7.5 pH at the scan rate of 0.1 V/s on BGPE (curve a) and PNNMGPE (curve b) surfaces. Here ‘curve a’ indicates the RF oxidation at BGPE with a lower oxidation peak current of -15.89 µA at the oxidation peak potential -0.468 V. However, RF on the surface of PNNMGPE (curve b) shows improved oxidation peak current (52.92 µA) at the oxidation peak potential of -0.459 V. This achieved information noticeably displays a satisfactory electrochemical action of RF at the modified sensor.
3.6. Effect of Scan Rate
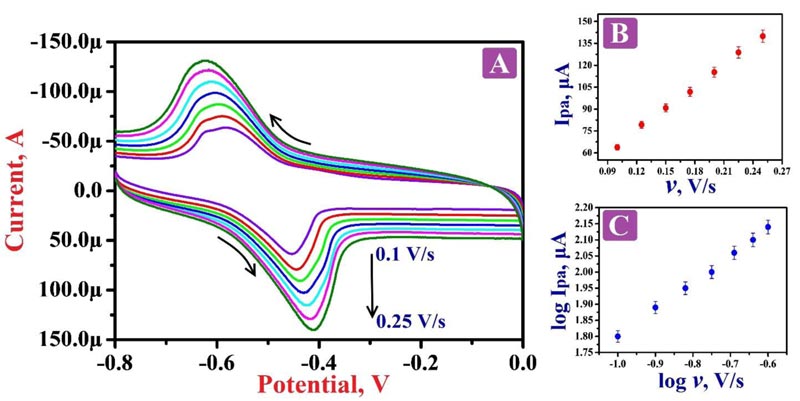
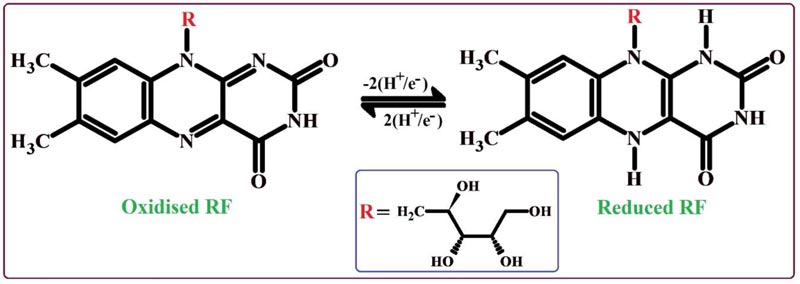
The nature of the electrode reaction towards 0.1 mM RF in 0.2 M PBS of 7.5 pH was examined by operating CV by varying the scan rate between the range of 0.1 - 0.25 V/s. Fig. (6A) demonstrates the CVs of RF; here the oxidation peaks shifted to the positive value and the reduction peaks shifted to the negative side by the increase of scan rate. The graphs of oxidation peak current v/s scan rate (Fig. 6B) and logarithmic value of oxidation peak current v/s logarithmic value of scan rate (Fig. 6C) shows fine linear associations with the linear regression equations Ipa (μA) = 14.76 + 503 v (V/s) (R2 = 0.9992) and log Ipa (μA) = 2.63 + 0.83 log v (V/s) (R2 = 0.9991), respectively. The results of these equations suggest that the redox reaction mechanism of RF on the surface of PNNMGPE takes place via adsorption controlled kinetics with the transfer of two electrons (Scheme 1).
3.7. Simultaneous Analysis of RF with AA and DA at PNNMGPE and BGPE
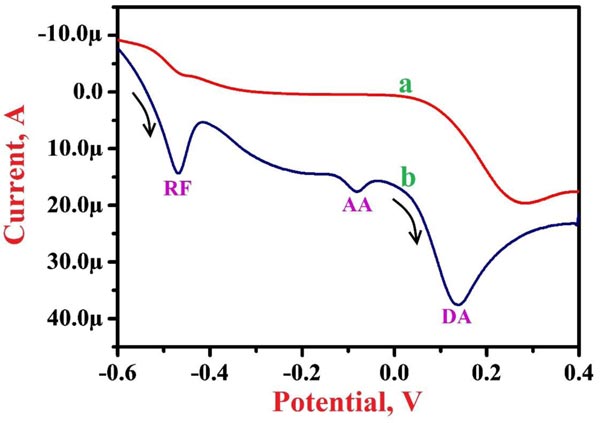
The simultaneous analysis of the projected PNNMGPE for 0.1 mM RF was conducted in the presence of 1.0 mM AA and 0.1 mM DA in PBS of 7.5 pH by LSV method to assess the possible analytical effects. Fig. (7) displays LSVs for RF, AA and DA at BGPE (curve a) and PNNMGPE (curve b). Here ‘curve b’ shows clear and fine oxidation peaks for RF, AA and DA on PNNMGPE at the oxidation potential of -0.469 V, -0.080 V and 0.138 V, respectively. However, ‘curve a’ does not reveal clear peaks for RF, AA and DA. The results demonstrate good catalytic action of the modified electrode for the electro-oxidation of RF in the presence and absence of AA and DA.
| Technique | Electrode | Linear range [µM] | LOD [µM] | Reference |
|---|---|---|---|---|
| DPV | Sodium lauryl sulphate modified carbonnanotube and pencil graphite composite paste electrode | 0.2–0.8 & 1–5 | 0.0166 | [50] |
| DPV | Poly dl-phenylalanine modified carbon paste sensor | 6.0-30.0 | 0.092 | [59] |
| SWASV [1] | Bismuth film electrode | 1.0-9.0 | 0.10 | [60] |
| SWV [2] | Rotating disc glassy carbon Hematite (α-Fe2O3) | 1.3-100 | 8.40 | [61] |
| DPV | Bi/annular band electrode | 10-337 | 2.40 | [62] |
| CV | Poly helianthin dye modified carbon paste electrode | 60–150 | 0.0402 | [63] |
| HPLC [3] | - | 20-90 | 0.295 | [64] |
| LSV | Poly Niacin modified carbon paste sensor | 5.0-65.0 | 0.782 | Current work |
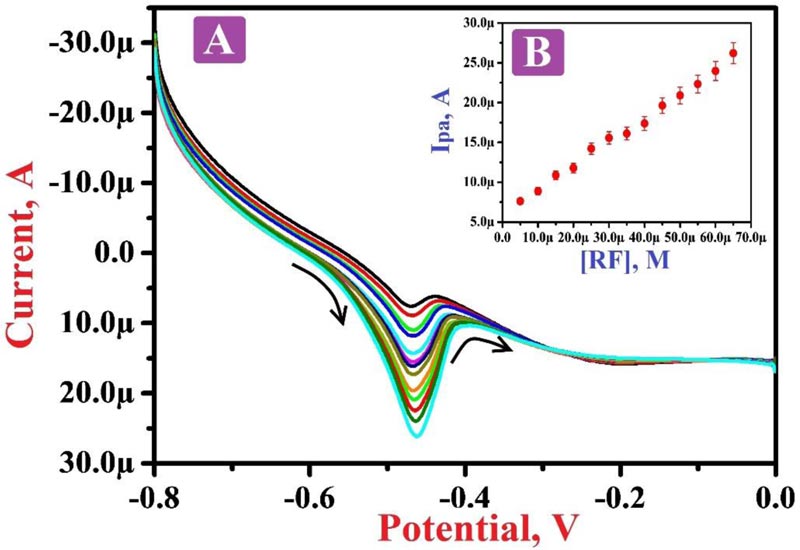
3.8. Concentration Variation
Fig. (8A) depicts the LSVs of different RF concentrations in the range of 5.0 µM to 65.0 µM in PBS of 7.5 pH. The plot Fig. (8B) of the oxidation peak current of RF and the concentration of RF shows a good linearity with the regression equation of Ipa (A) = 6.0792×10⁻⁶ + 0.2999 [RF] (A/M) (R2 = 0.9974). Also, it displays that as the concentration of RF increases, the oxidation current of RF also increases. The values of LOD and LOQ were calculated to be 0.782 µM and 2.7608 µM, respectively. Table 1 shows the comparison of some of the previous reports with our projected electrode and LOD [49, 59-63].
3.9. Stability and Reproducibility of PNNMGPE
The stability of the projected PNNMGPE for the detection of RF in 0.2 M PBS (pH 7.5) was examined by CV by 30 subsequent CV cycles in optimal circumstances. The percentage of degradation value discloses that PNNMGPE exhibits 88% of the preliminary current signal even after 30 CV cycles, showing acceptable stability. The reproducibility of the PNNMGPE was analysed by cycling 5 consecutive CV cycles with 2.8% of relative standard deviation, showing excellent reproducibility.
3.10. Analysis of RF in the Pharmaceutical Sample
Determination of RF in a pharmaceutical sample (B-Complex capsule) was completed by the application of the suggested PNNMGPE via the LSV technique. The resultant B-complex capsule sample was examined by the standard addition process. The suggested working electrode reveals a fine electrocatalytic action with superior sensitivity and consistency for the RF detection in the B-Complex capsule in the presence of some other molecules with an acceptable recovery (Table 2).
| Pharmaceutical Sample | Added Concentration (µM) | Found Concentration (µM) | Recovery (%) |
|---|---|---|---|
| B-Complex capsule | 5.0 | 5.17 | 103.4 |
| 10.0 | 9.66 | 96.62 | |
| 20.0 | 18.84 | 94.22 |
CONCLUSION
This work describes the high sensitive analysis of RF by the application of poly (NN) modification on the surface of graphite paste. The electrochemical redox response of RF on the surface of the projected electrode was quasi-reversible with adsorption controlled kinetics. The comparative study displays that the BGPE was less sensitive than the modified sensor. The projected operating electrode shows an easy preparation process with low-cost, fine sensitivity and rapid response. The proposed PNNMGPE was effectively tested for the analysis of RF moiety in the B-Complex capsule sample as an analytical utility.
CONSENT FOR PUBLICATION
Not applicable.
AVAILABILITY OF DATA AND MATERIALS
Not applicable.
FUNDING
The study is financially supported by VGST, Bangalore, India under Research Project. No. KSTePS/VGST-KFIST (L1)2016-2017/GRD-559/2017-18/126 /333, 21/11/2017.
CONFLICT OF INTEREST
The authors declare no conflict of interest, financial or otherwise.
ACKNOWLEDGEMENTS
We gratefully acknowledge the financial support from the VGST, Bangalore.